
FortiTelemetry
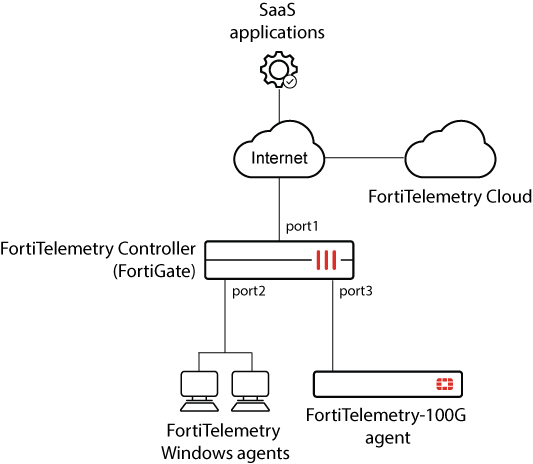
FortiTelemetry provides information about the SaaS user experience based on application and network performance. FortiTelemetry agents send raw application-level and network-level metrics to FortiTelemetry Cloud for data analysis. Based on its analytics, FortiTelemetry Cloud returns to the FortiGate acting as a FortiTelemetry Controller two additional metrics: application experience score and application failure rate. FortiTelemetry Controller presents the metrics on FortiTelemetry monitor pages.
A FortiTelemetry deployment consists of one FortiGate hardware model acting as FortiTelemetry Controller and one or more FortiTelemetry agents:
-
The FortiTelemetry Controller manages the agents by onboarding them to the Security Fabric, managing telemetry profiles and policies, and providing monitoring tools to give administrators a view of application metrics and statistics.
-
FortiTelemetry agents are on-premise FortiGate-integrated telemetry agents that continuously emulate, monitor, and detect performance metrics across SaaS applications without any user intervention or involvement.
Following is a summary of information available to deploy and configure FortiGate acting as a FortiTelemetry Controller:
-
Configure a FortiGate hardware model to act as a FortiTelemetry Controller. See Configuring a FortiTelemetry Controller.
-
Deploy FortiTelemetry agents. See the FortiTelemetry Administration Guide for details.
-
On the FortiTelemetry Controller:
-
Authorize automatically discovered FortiTelemetry agents. See Connecting to FortiTelemetry agents.
A telemetry address object is automatically created for each authorized FortiTelemetry agent.
-
View telemetry addresses, and optionally create telemetry address groups. See Telemetry addresses and address groups.
-
Create a telemetry profile. See Creating telemetry profiles.
-
Create a Telemetry firewall policy, select telemetry addresses or address groups, and select the telemetry profile. See Telemetry policy.
-
Add a FortiTelemetry monitor to view the collected information. See Adding FortiTelemetry monitors.
-
Enable system event logs for FortiTelemetry. See FortiTelemetry events.
-
For details about FortiOS CLI commands that can be used to configure the FortiTelemetry Controller, see Config CLI commands.
For details about FortiOS CLI commands that can be used to view different properties related to FortiTelemetry, see Get and Diagnose commands.