Asset details
The Asset Details pane provides comprehensive endpoint information to streamline the diagnostic process and reduce reliance on CLI commands.
To view the Asset Details pane:
-
Go to Dashboard > Assets & Identities.
-
Hover over the Assets widget, and click Click to Expand. The Assets monitor opens.
If you are using the Comprehensive dashboard template, go to Device Inventory Monitor.
-
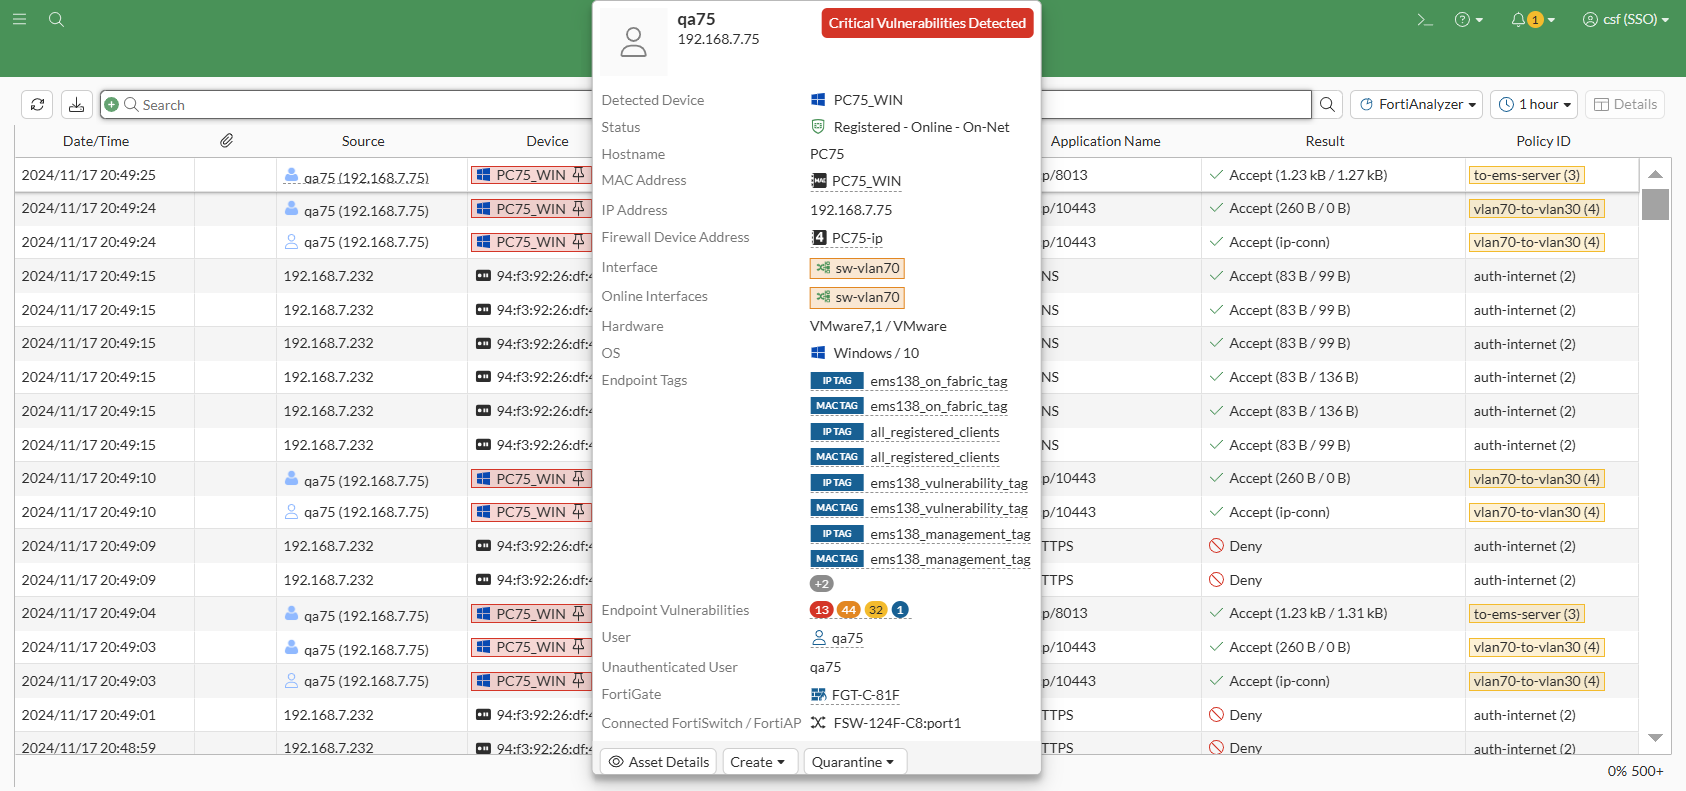
Select a row to display a toolbar that includes the Asset Details button:
You can also hover over the device to display a tooltip with the Asset Details button.
-
Click Asset Details to display the details.
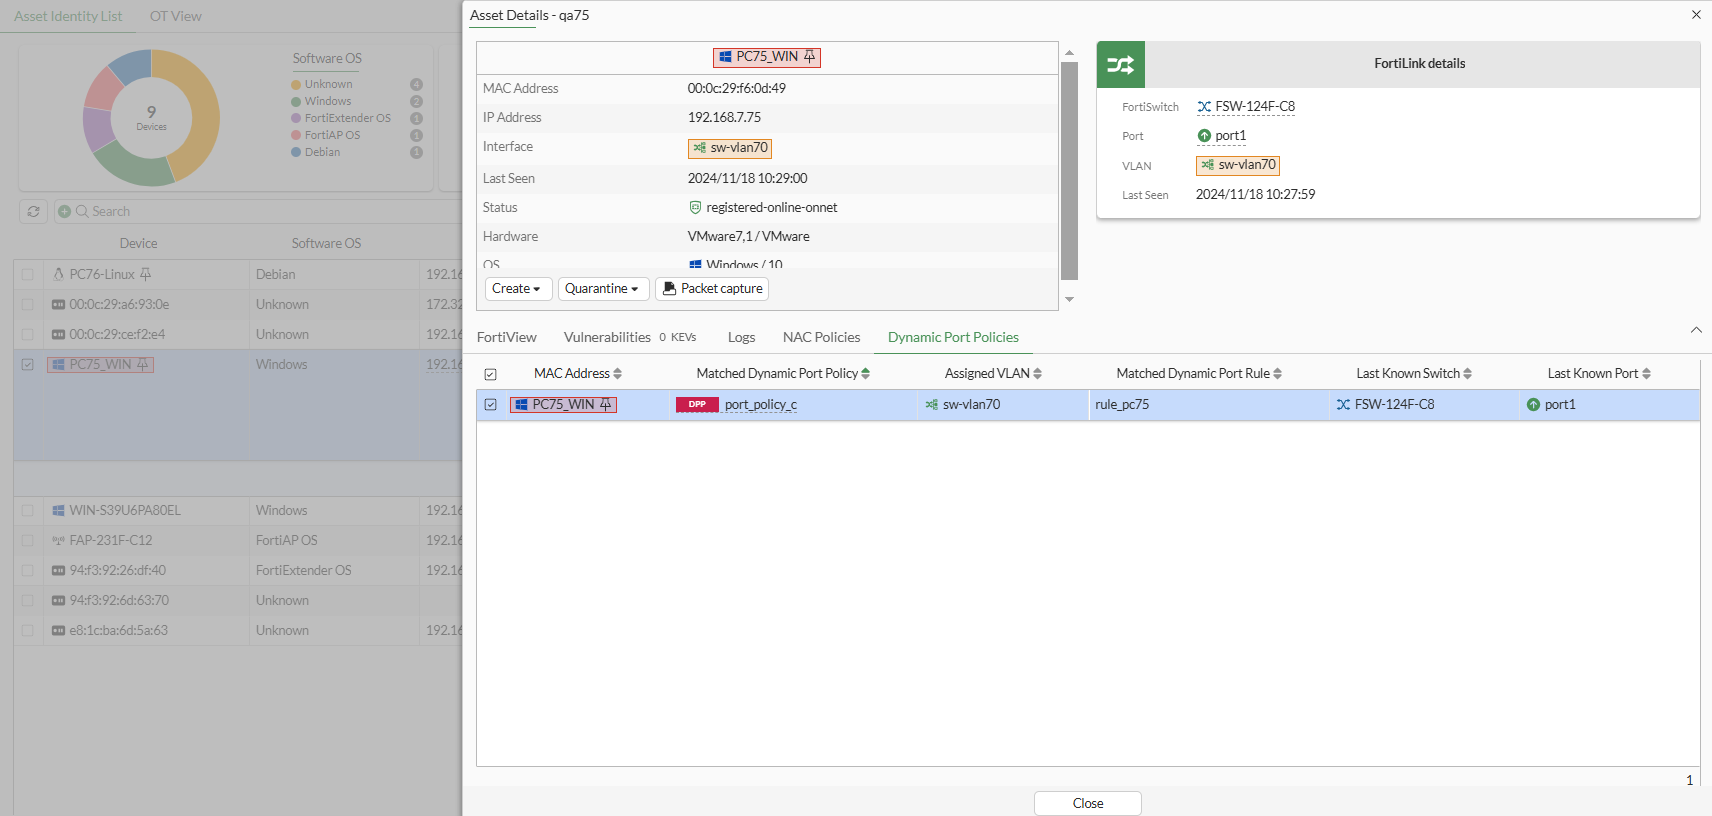
On the top-left of the Asset Details pane is information about the endpoint, such as MAC address, IP address, interface, and so on. The following buttons are also available for the endpoint:
-
Create > Firewall Address
-
Create > Firewall Policy
-
Quarantine > Quarantine Host
-
Quarantine > Ban IP
-
Disassociate is available for endpoints using a WiFi interface
-
Packet capture
On the top-right are details about the WiFi or FortiLink interface when used by the endpoint.
Along the bottom are tabs of information, depending on the endpoint and interface used:
Tab
Subtabs
FortiView
Applications
Destinations
Sources
Policies
Vulnerabilities/Vulnerabilities <number> KEVs
FortiClient
IoT/OT
Logs
Forward Traffic
ZTNA Traffic
WiFi Events
WiFi Performance
N/A
NAC Policies N/A Dynamic Port Policies
N/A
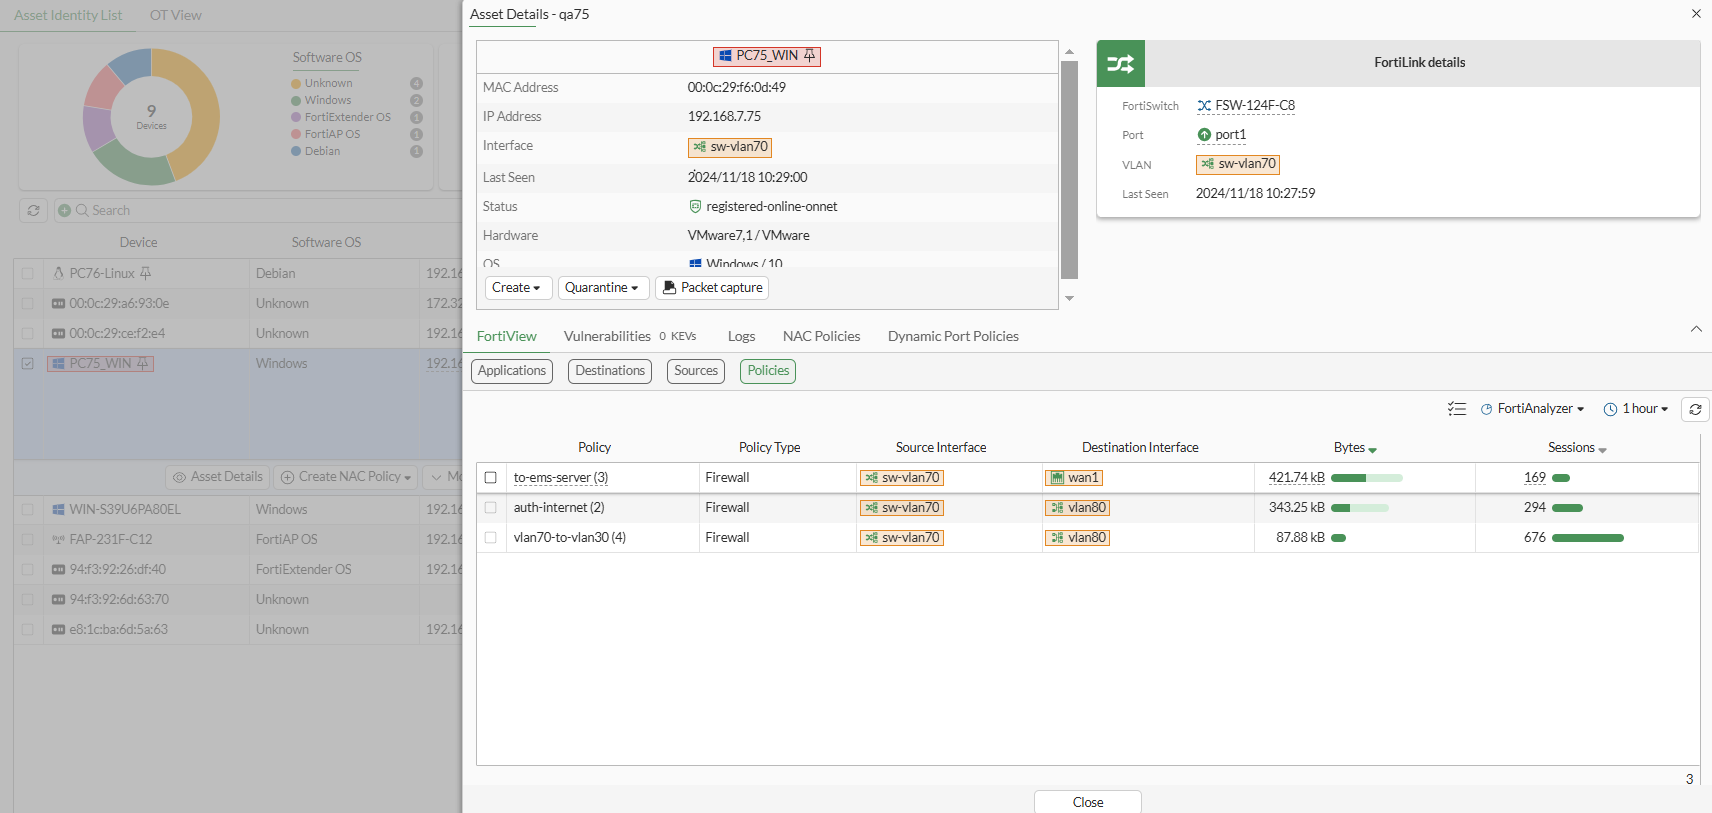
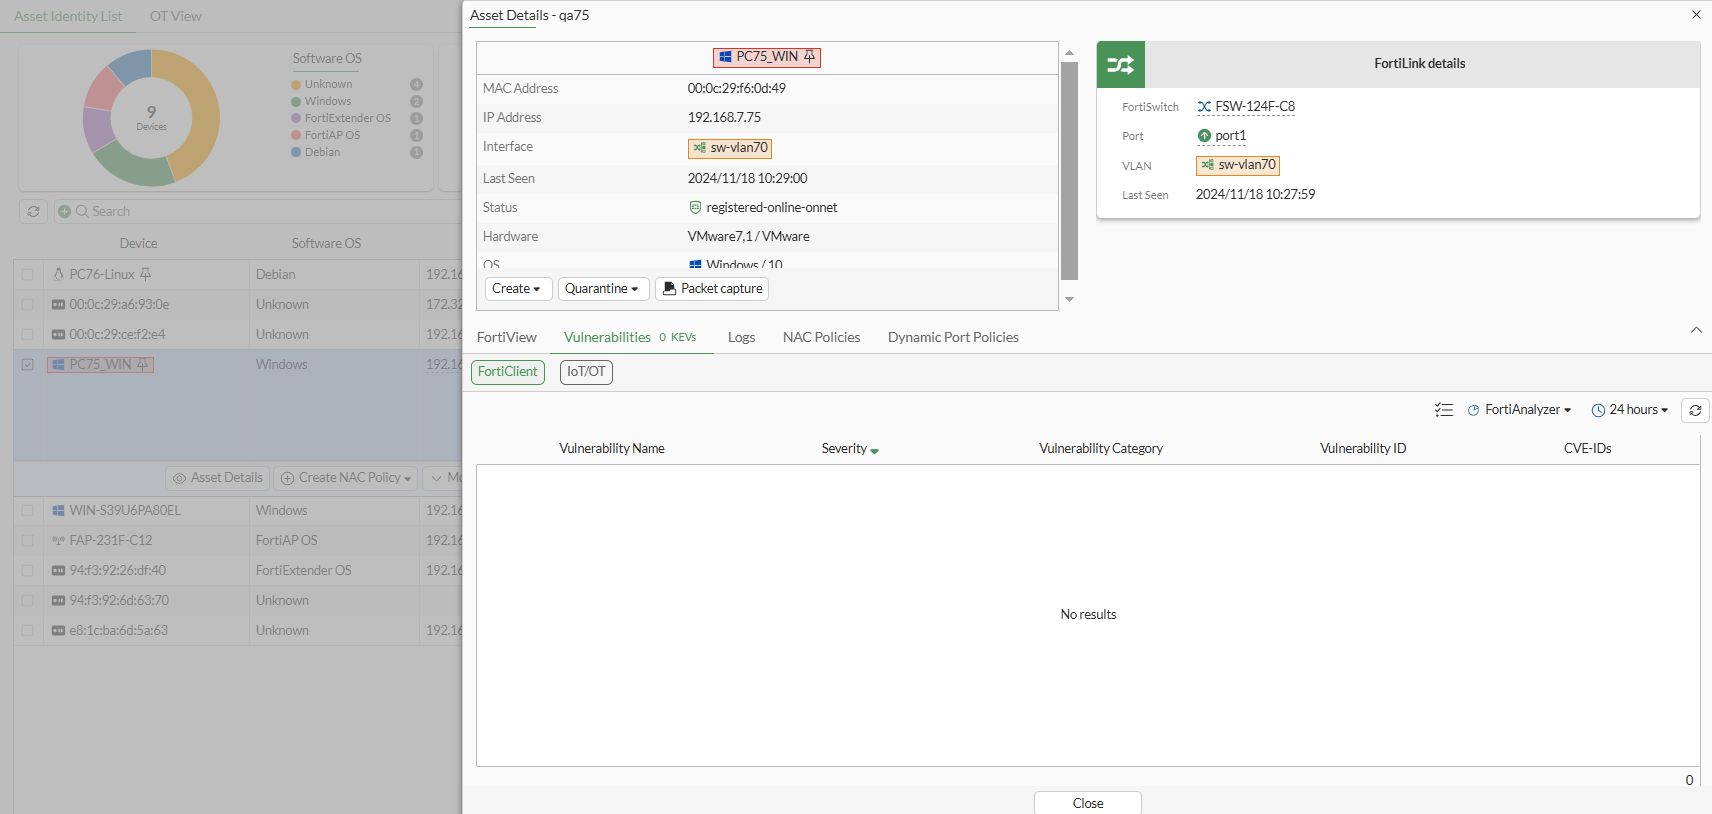
Following are examples of the Asset Details pane for an endpoint named PC75_WIN using a VLAN interface:
-
The FortiView > Policies tab:
-
The Vulnerabilities > FortiClient tab:
-
The Dynamic Port Policies tab:
-
You can also access the Asset Details pane by clicking the Asset Details button from the following GUI locations:
-
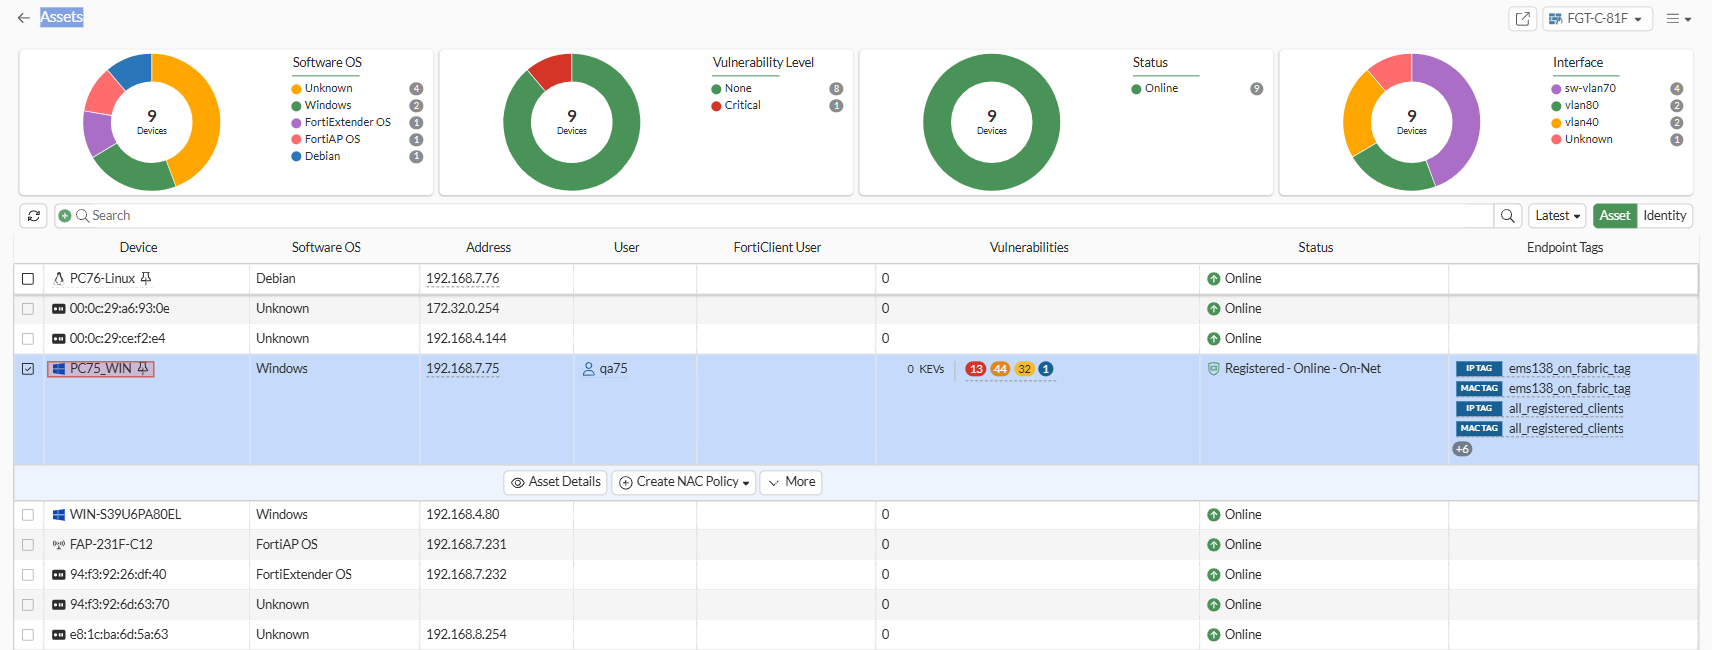
On the Dashboard > Assets & Identities page:
-
Assets - Vulnerabilities
-
Assets - FortiClient
-
-
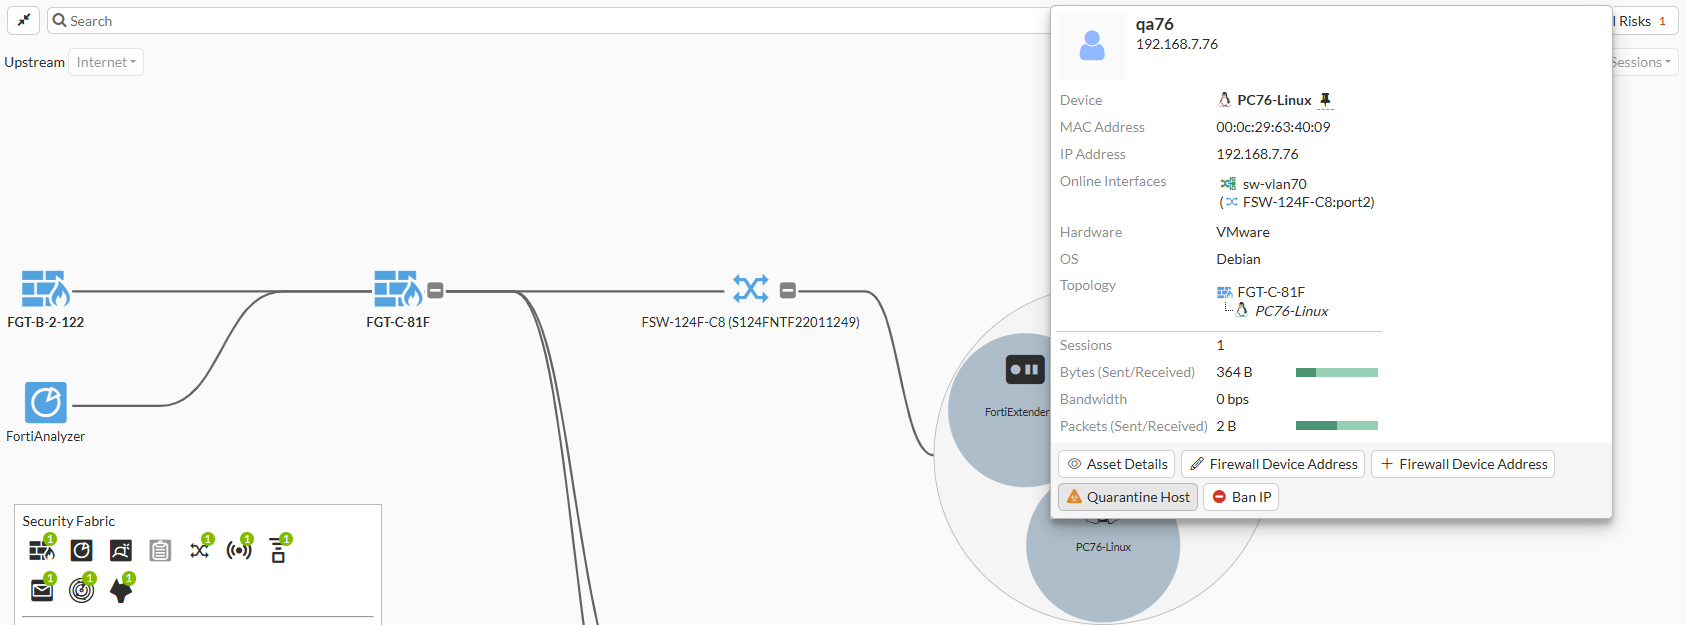
On the Security Fabric page:
-
Go to Physical Topology, and hover over an endpoint to display a tooltip that includes the Asset Details button.
-
Go to Asset Identity Center page. Hover over a device to display a tooltip that includes the Asset Details button, or select a row in the table to display a toolbar that includes the Asset Details button.
-
-
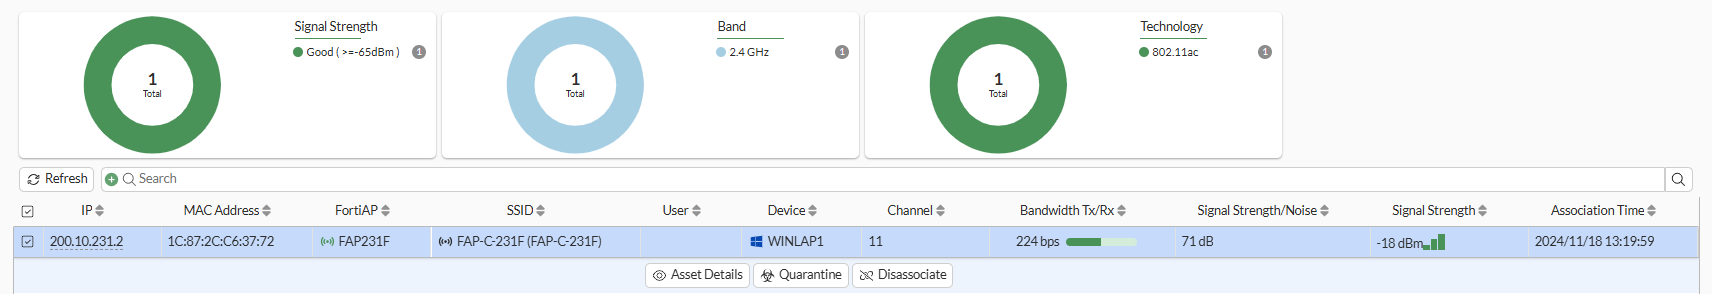
In the WiFi & Switch Controller menu:
-
Go to WiFi Clients. Hover over a device to display a tooltip that includes the Asset Details button, or select a row in the table to display a toolbar that includes the Asset Details button.
-
Go to FortiSwitch Clients. Hover over a device to display a tooltip that includes the Asset Details button, or select a row in the table to display a toolbar that includes the Asset Details button.
-
-
On the Log & Report > Forward Traffic page, hover over a device to display a tooltip that includes the Asset Details button: