
IPsec monitor
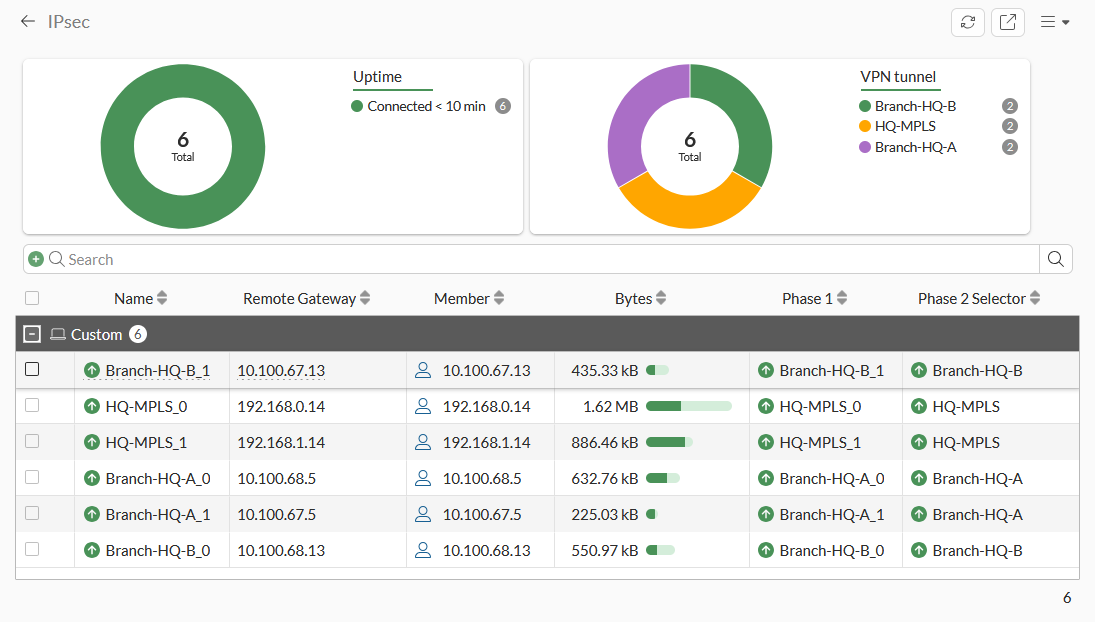
The IPsec monitor displays all connected Site to Site VPN, Dial-up VPNs, and ADVPN shortcut tunnel information. It also includes pie charts for tunnel status and uptime, filters, and quick access to several tools. You can use the monitor to bring a phase 2 tunnel up or down or disconnect dial-up users. A notification appears in the monitor when users have not enabled two-factor authentication.
To access the IPsec monitor in the GUI:
-
Use one of the following methods:
-
Go to Dashboard > Network and hover over the IPsec widget, and click Expand to Full Screen. A warning appears when an unauthenticated user is detected.

To filter or configure a column in the table, hover over the column heading and click the Filter/Configure Column button.
-
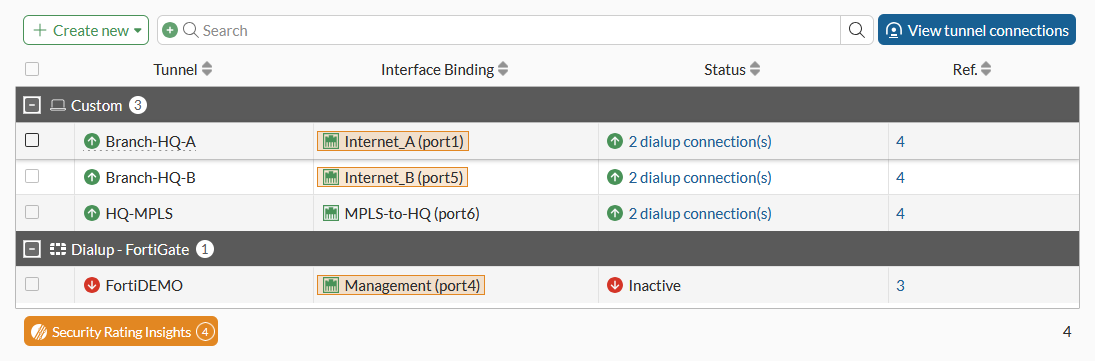
Go to VPN > VPN Tunnels and click View tunnel connections.
-
-
Hover over a record in the table. A tooltip displays the Phase 1 and Phase 2 interfaces. A warning appears next to a user who has not enabled two-factor authentication.
-
Click each pie chart to filter its information.
For example, in the VPN tunnel pie chart, click the green pie or Hub-1. A filter icon displays beside VPN tunnel, the filter text displays in the Search bar, and the table displays the filtered results too.
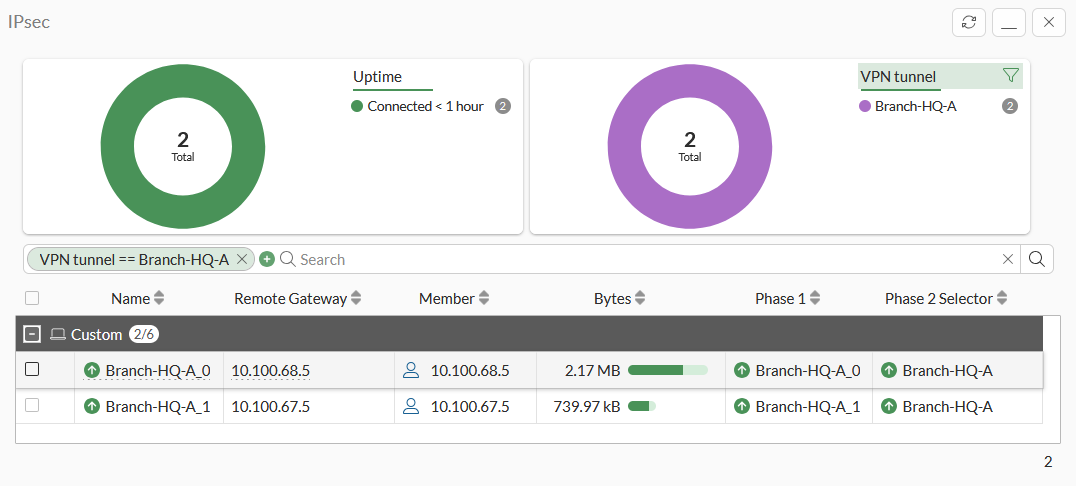
Clear the filter by clicking the filter icon beside VPN tunnel or clicking an X in the Search bar.
-
Configure and filter the table as required, see Tables for more information.
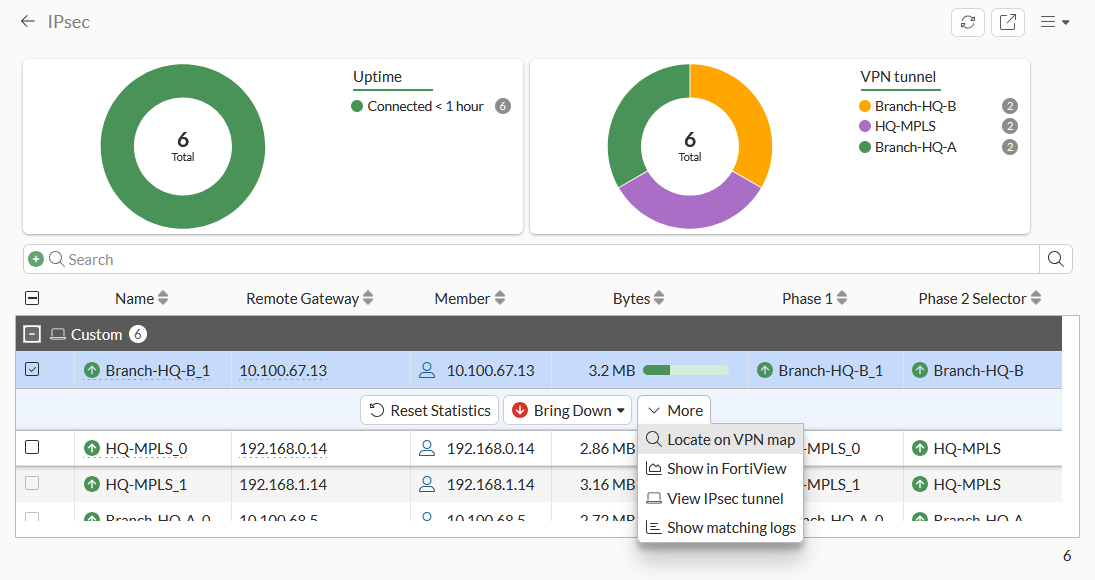
To reset statistics:
-
Select a tunnel in the table.
-
In the toolbar, click Reset Statistics or right-click the tunnel, and click Reset Statistics. The Confirm dialog is displayed.
-
Click OK.
To bring a tunnel up:
-
Select a tunnel in the table.
-
Click Bring Up, or right-click the tunnel, and click Bring Up. The Confirm dialog is displayed.
-
Click OK.
To bring a tunnel down:
-
Select a tunnel in the table.
-
Click Bring Down, or right-click the tunnel, and click Bring Down.
The entire tunnel, a phase 2 selector, or all phase 2 selectors can be brought down.
The Confirm dialog is displayed.
-
Click OK.
To locate a tunnel on the VPN Map:
-
Select a tunnel in the table.
-
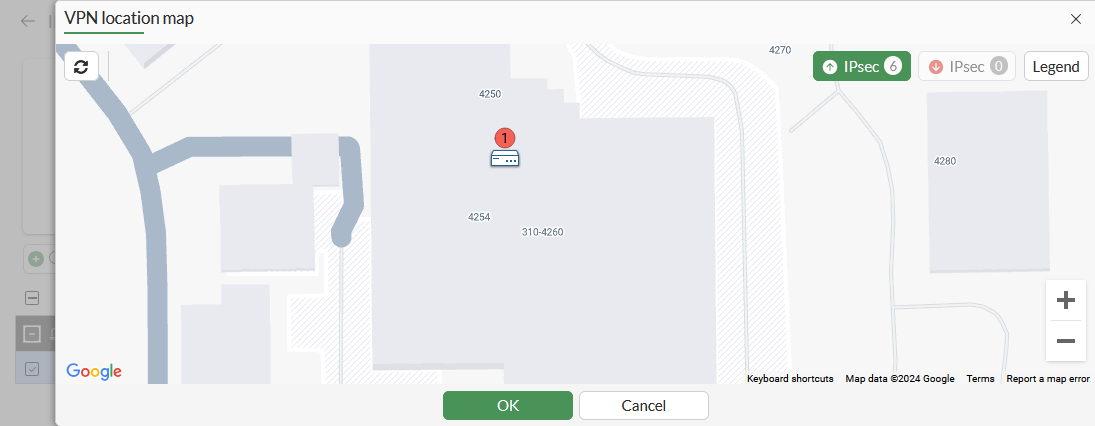
Click More > Locate on VPN Map, or right-click the tunnel, and click Locate on VPN Map.
The VPN Location Map is displayed.
-
Click OK to close the map.
To view tunnel connection in FortiView:
-
In the table, select a tunnel.
-
Click More > Show in FortiView, or right-click the tunnel and click Show in FortiView. The FortiView VPN pane is displayed.
-
Click X to close the pane.
To view the IPsec tunnel:
-
In the table, select a tunnel.
-
Click More > View IPsec tunnel, or right-click the tunnel and click View IPsec tunnel. The VPN Tunnels pane, filtered to the selected tunnel, is displayed.
-
Click OK or Cancel to close the pane.
To view matching logs for the tunnel:
-
In the table, select a tunnel.
-
Click More > Show matching Logs, or right-click the tunnel and click Show matching logs. The Logs pane is displayed.
-
Click OK to close the pane.
To view the IPsec monitor in the CLI:
# diagnose vpn tunnel list
Sample output:
list all ipsec tunnel in vd 0
------------------------------------------------------
name=Branch-HQ-B_1 ver=2 serial=8 10.100.65.101:0->10.100.67.13:0 tun_id=10.0.11.2 tun_id6=::10.0.0.8 dst_mtu=1500 dpd-link=on weight=1
bound_if=7 lgwy=static/1 tun=intf mode=dial_inst/3 encap=none/74408 options[122a8]=npu rgwy-chg frag-rfc  run_state=0 role=primary accept_traffic=1 overlay_id=0

parent=Branch-HQ-B index=1
proxyid_num=1 child_num=0 refcnt=5 ilast=0 olast=0 ad=s/1
stat: rxp=1000472 txp=869913 rxb=184682116 txb=40548952
dpd: mode=on-idle on=1 idle=60000ms retry=3 count=0 seqno=1
natt: mode=none draft=0 interval=0 remote_port=0
fec: egress=0 ingress=0
proxyid=Branch-HQ-B proto=0 sa=1 ref=6 serial=1 ads
  src: 0:0.0.0.0-255.255.255.255:0
  dst: 0:0.0.0.0-255.255.255.255:0
  SA:  ref=3 options=20a03 type=00 soft=0 mtu=1438 expire=414/0B replaywin=2048
       seqno=1bcc esn=0 replaywin_lastseq=0000201a qat=0 rekey=0 hash_search_len=1
  life: type=01 bytes=0/0 timeout=1790/1800
  dec: spi=b4d54183 esp=aes key=16 6735d235de02f37d26809c0e8be44bbf
       ah=sha1 key=20 17261a0387d9c9a33a00a47bcf260fc59150535e
  enc: spi=28572715 esp=aes key=16 48b8a72ae69eee58699b43692ce1ccf1
       ah=sha1 key=20 3e7a219f4da33c785302ae7b935a6c15c4cc2a2a
  dec:pkts/bytes=16434/3317744, enc:pkts/bytes=14230/1299224
  npu_flag=00 npu_rgwy=10.100.67.13 npu_lgwy=10.100.65.101 npu_selid=3 dec_npuid=0 enc_npuid=0
------------------------------------------------------
name=Branch-HQ-A ver=2 serial=1 10.100.64.101:0->0.0.0.0:0 tun_id=10.0.0.1 tun_id6=::10.0.0.1 dst_mtu=0 dpd-link=on weight=1
bound_if=3 lgwy=static/1 tun=intf mode=dialup/2 encap=none/552 options[0228]=npu frag-rfc  role=primary accept_traffic=1 overlay_id=0

proxyid_num=0 child_num=2 refcnt=4 ilast=43124593 olast=43124593 ad=/0
stat: rxp=1860386 txp=1598633 rxb=215561858 txb=71724716
dpd: mode=on-idle on=0 idle=60000ms retry=3 count=0 seqno=0
natt: mode=none draft=0 interval=0 remote_port=0
fec: egress=0 ingress=0
run_tally=0
------------------------------------------------------
name=Branch-HQ-B ver=2 serial=2 10.100.65.101:0->0.0.0.0:0 tun_id=10.0.0.2 tun_id6=::10.0.0.2 dst_mtu=0 dpd-link=on weight=1
...