Fortinet white logo
Fortinet white logo

New Features

Netflow / IPFIX Support

Netflow / IPFIX Support

Support for Netflow (v1, v5, v9) and IPFIX (IP Flow Information Export) is added to FortiSwitch 6.2, and the resulting data will be available to FortiAnalyzer (and FortiView) for new traffic statistics and topology views. Traffic sampling data can be used to show which users or devices behind switches are generating the highest traffic in those networks.

You can now configure Netflow/IPFIX on managed FortiSwitch units on switch controller.
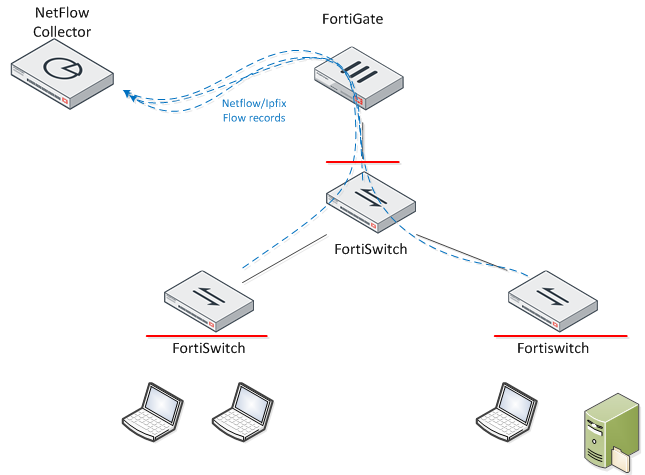
You can configure flow-tracking related parameters by using the default values:

# config switch-controller flow-tracking

(flow-tracking) # get

sample-mode : perimeter

sample-rate : 512

format : netflow9

collector-ip : 0.0.0.0 ------> all-zero IP address implies disabled

collector-port : 0

transport : udp

level : ip

filter : -------> complies with tcpdump/wireshark filter syntax

max-export-pkt-size : 512

timeout-general : 3600

timeout-icmp : 300

timeout-max : 604800

timeout-tcp : 3600

timeout-tcp-fin : 300

timeout-tcp-rst : 120

timeout-udp : 300

aggregates:

Following are the sampling mode options:

  • Perimeter sampling: RX sampling enabled on all non-fabric FortiSwitch ports, including access port and FortiLink port, but not the FortiLink ISL port.
  • Device-Ingress sampling: RX sampling enabled on all FortiSwitch ports.
  • Local sampling: Sampling must be enabled on specific FortiSwitch ports by using config switch-controller managed-switch and config ports.

Netflow / IPFIX Support

Netflow / IPFIX Support

Support for Netflow (v1, v5, v9) and IPFIX (IP Flow Information Export) is added to FortiSwitch 6.2, and the resulting data will be available to FortiAnalyzer (and FortiView) for new traffic statistics and topology views. Traffic sampling data can be used to show which users or devices behind switches are generating the highest traffic in those networks.

You can now configure Netflow/IPFIX on managed FortiSwitch units on switch controller.

You can configure flow-tracking related parameters by using the default values:

# config switch-controller flow-tracking

(flow-tracking) # get

sample-mode : perimeter

sample-rate : 512

format : netflow9

collector-ip : 0.0.0.0 ------> all-zero IP address implies disabled

collector-port : 0

transport : udp

level : ip

filter : -------> complies with tcpdump/wireshark filter syntax

max-export-pkt-size : 512

timeout-general : 3600

timeout-icmp : 300

timeout-max : 604800

timeout-tcp : 3600

timeout-tcp-fin : 300

timeout-tcp-rst : 120

timeout-udp : 300

aggregates:

Following are the sampling mode options:

  • Perimeter sampling: RX sampling enabled on all non-fabric FortiSwitch ports, including access port and FortiLink port, but not the FortiLink ISL port.
  • Device-Ingress sampling: RX sampling enabled on all FortiSwitch ports.
  • Local sampling: Sampling must be enabled on specific FortiSwitch ports by using config switch-controller managed-switch and config ports.