Monitoring an HA cluster
FortiADC provides several tools to monitor the status of your HA cluster from the Dashboard, Top navigation, and the High Availability pages.
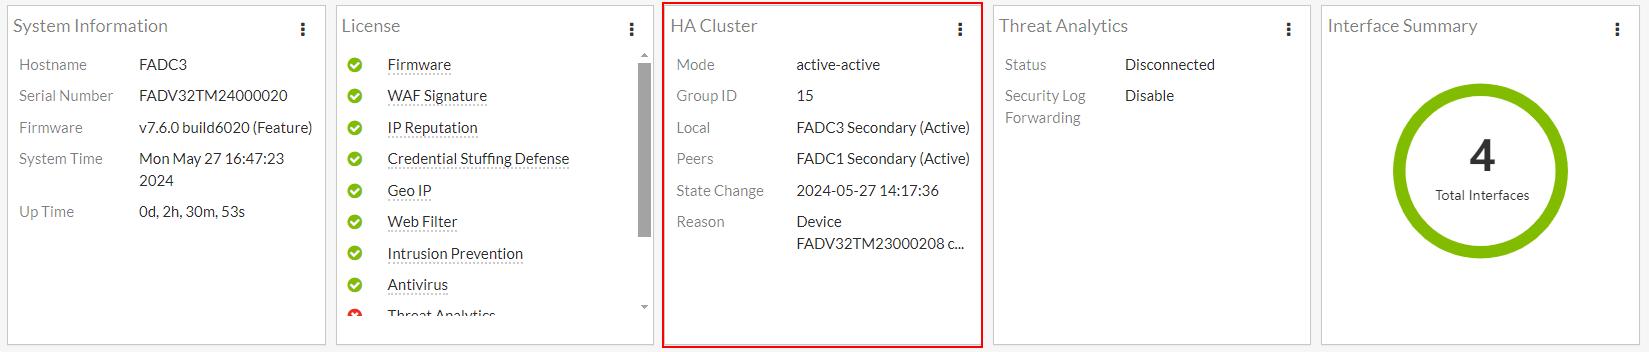
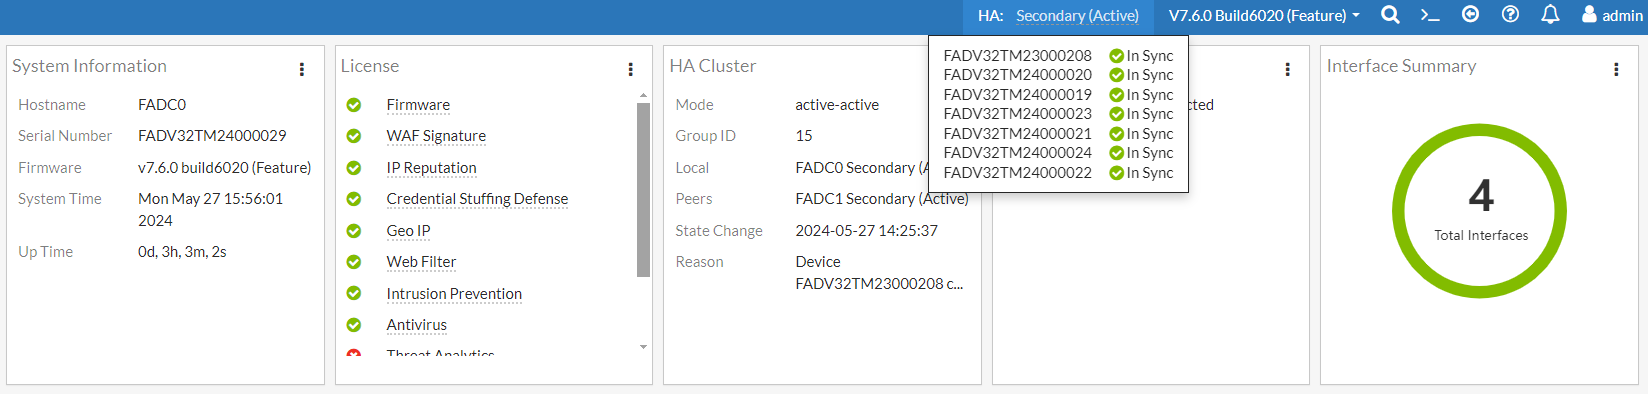
HA Cluster Dashboard widget
From the Dashboard > Main page, you can view the HA status from the system dashboard HA Cluster widget. You can click the  (vertical ellipsis icon) and click See Detail to view the topology of the HA cluster.
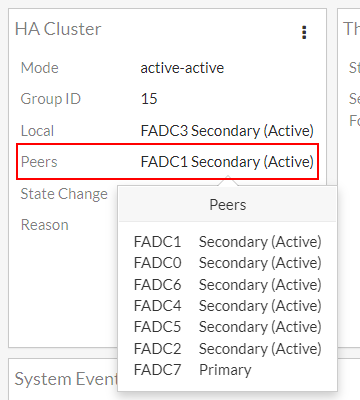
When you hover over the Peers field, it displays the list of Peer nodes that are part of the HA cluster and their statuses.
Top Navigation bar
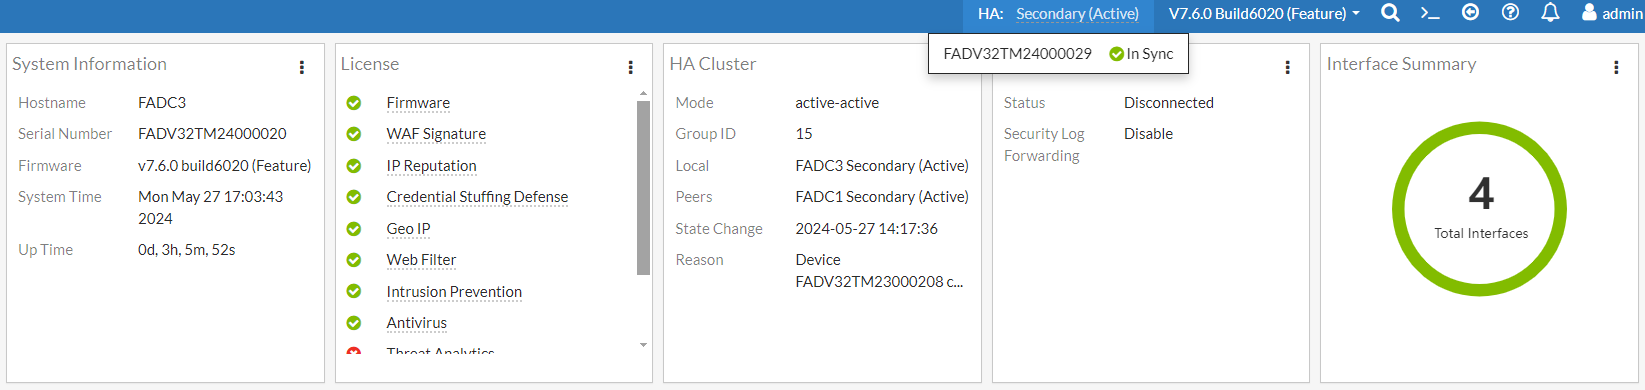
The HA status of the local node is displayed in the Top Navigation bar. When you hover over this status, you can view its HA synchronization status.
In this example, you will see that the local node FADC3 is currently In Sync with another device with the serial number FADV32TM24000029. This means that the local node is not the configuration source, the device that it is currently synchronized to is the configuration source.
Below is what is displayed if your local node is the configuration source. You will see the list of devices that are currently synchronized to its HA configuration settings, including node FADC3 (you can verify this with the Serial Number from the System Information widget).
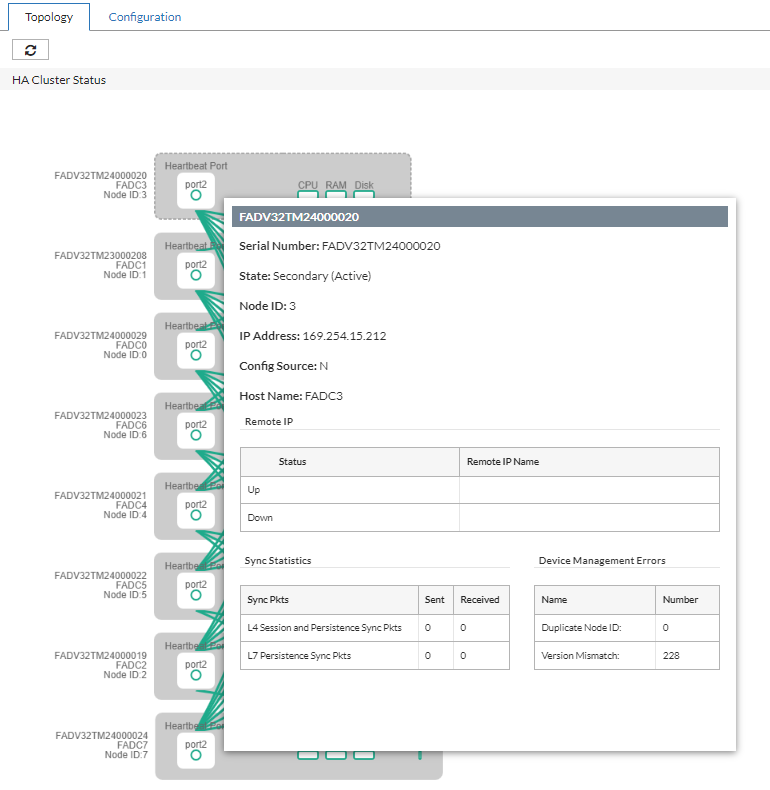
High Availability > Topology page
To view the topology of your HA cluster, navigate to System > High Availability > Topology.
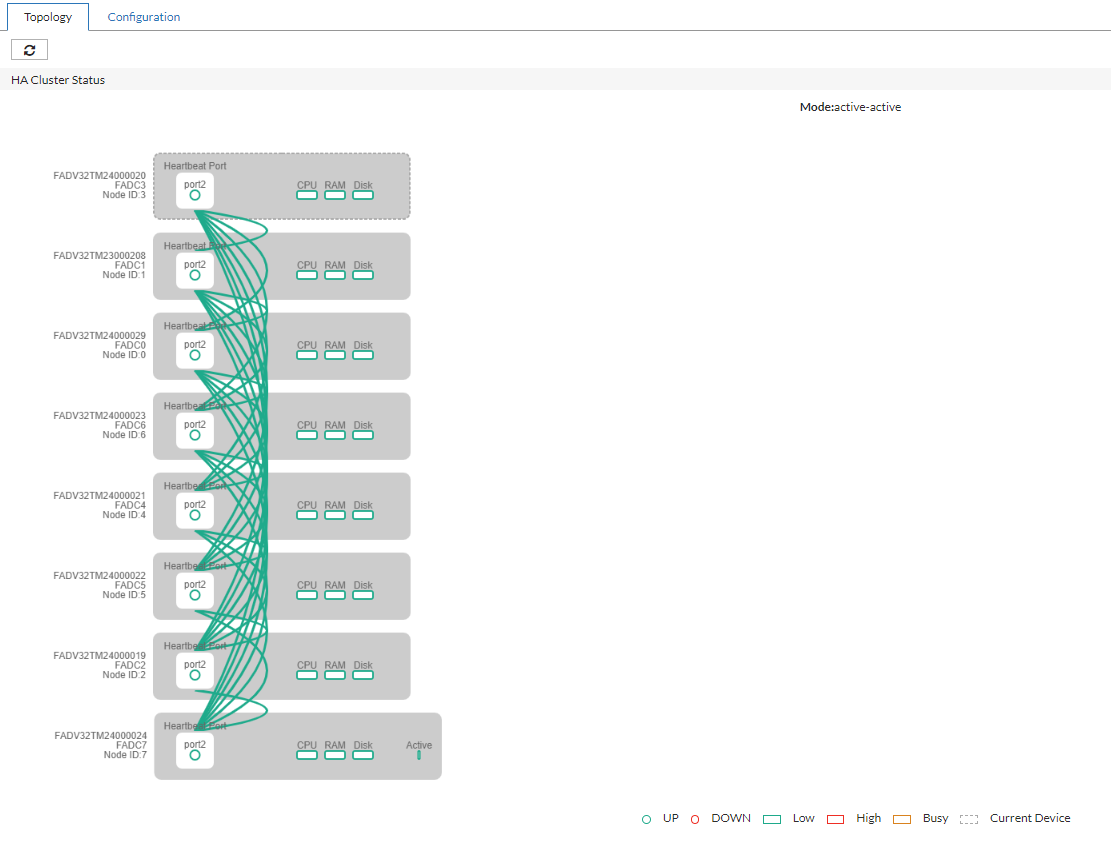
Hover over any device to drill down to the detailed information about the HA cluster member.
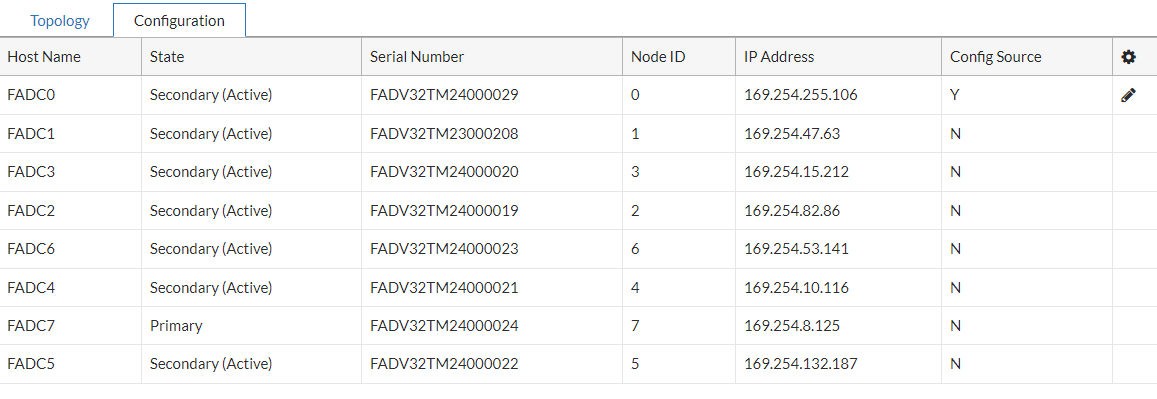
High Availability > Configuration page
To view the list of member nodes in your HA cluster, navigate to System > High Availability > Configuration.
|
Column |
Description |
|---|---|
| Host Name | The Host Name of the member node. |
| State | Indicates the HA status of the node and whether it is elected as the HA Primary or Secondary nodes. |
| Serial Number | The Serial Number of the FortiADC devices in the HA cluster. |
| Node ID | The Node ID of the member node. |
| IP Address | The HA in-cluster communication IP address. |
| Config Source |
Indicates whether the member node is the source of configurations for HA synchronization. This is determined by the Config Priority set in the HA setting. When the configuration priority values of the nodes are different, the configuration of the device with the lower configuration priority will prevail. |
Other HA monitoring methods
You can also use log messages, alert emails, and SNMP to monitor HA events, such as when failover has occurred. The system logs HA node status changes as follows:
- When HA is initialized:
HA device Init - When a member joins a group:
Member (FAD2HD3A12000003) join to the HA group - When the HA configuration is changed from standalone to an Active-Passive or Active-Active cluster mode:
HA device into secondary mode
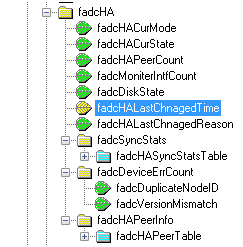
The following figure shows FortiADC HA event objects in an SNMP manager.
FortiADC HA event objects in an SNMP manager