
Using widgets
You can temporarily expand a widget to a standalone monitor, change the view type, configure tables, and filter data.
To expand a dashboard widget to a monitor:
-
Hover over the widget and click Expand to full screen.
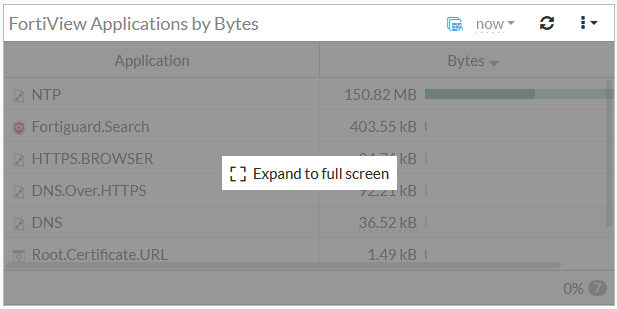
Full screen mode is not supported in all widgets.
-
On the top-left, click the back arrow to return to the widget.
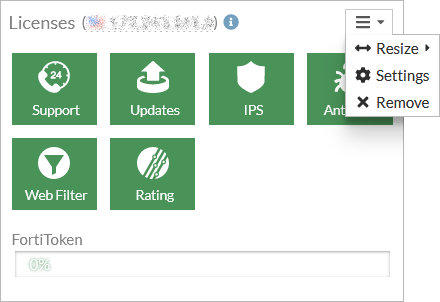
To view the widget settings:
-
Click the menu dropdown at the right side of the widget and select Settings.
-
Configure the widget settings and click OK.
The settings will vary depending on the widget.
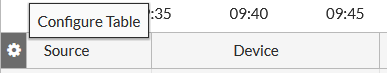
To configure a table in a monitor:
-
Hover over the left side of the table header and click Configure Table.
-
Configure the table options:
Option
Description
Best Fit Columns
Resizes all of the columns in a table to fit their content.
Reset Table
Resets the table to the default view.
Export
Export the table data to a CSV or JSON file. Only available for applicable tables.
Select Columns
Adds or removes columns from the view.
-
Click Apply.
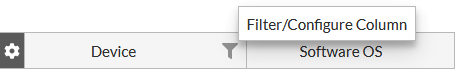
To filter or configure a column in a table:
-
Hover over a column heading, and click Filter/Configure Column.
-
Configure the column options.
Option
Description
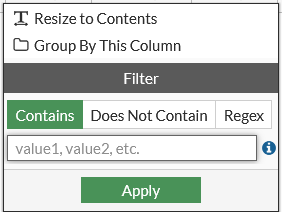
Resize to Contents
Resizes the column to fit the content.
Group by this Column
Groups the table rows by the contents in the selected column.
-
Click Apply.
-
To filter a column, enter a value in the Filter field, and click Apply.
Filtering is not supported in all widgets.
See also Widgets in VDOM mode.