
Dashboard
A dashboard is a collection of widgets and monitors that display information about your FortiGate and network:
-
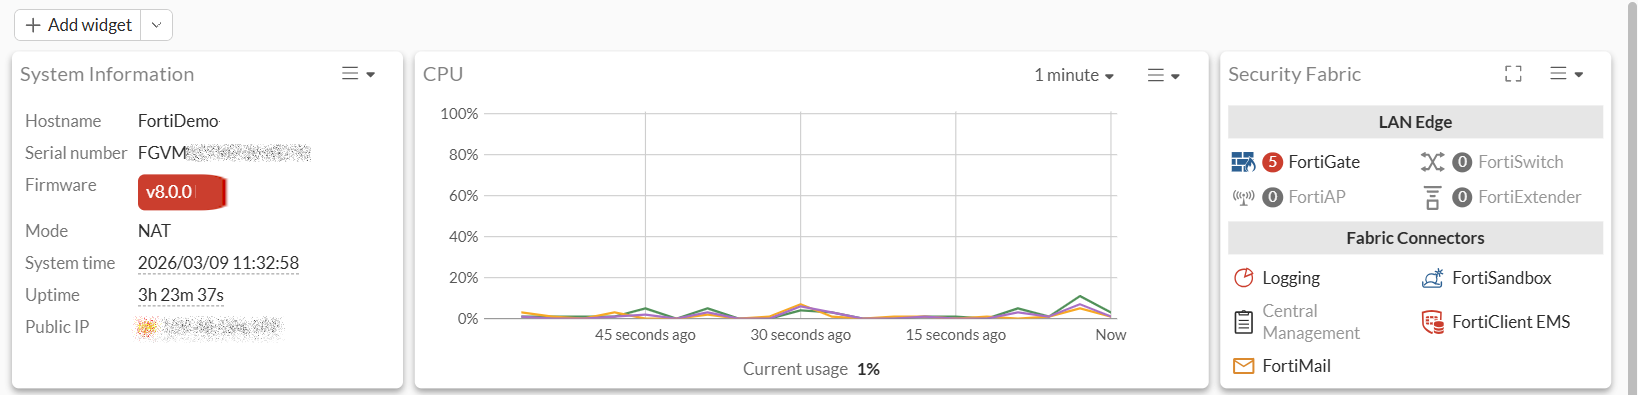
Widgets are condensed monitors, and multiple widgets can be displayed on one tab.
For example, the Status dashboard contains several widgets, such as the System Information, CPU, Security Fabric, and more:
-
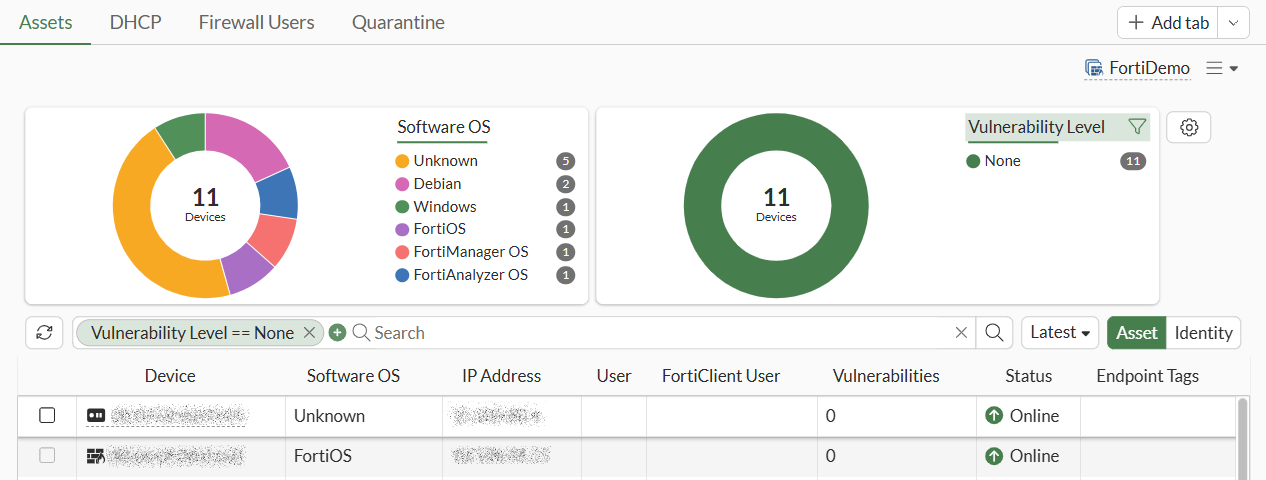
Monitors focus on the details of one area and fill an entire tab.
For example the Assets and Identities dashboard contains the Assets, DHCP, Firewall Users, and Quarantine tabs of monitors:
FortiOS includes the following predefined dashboards:
|
Dashboard |
Default display: |
|---|---|
|
The Status dashboard is one tab that displays the following widgets:
|
|
| Assets and Identities |
The Assets and Identities dashboard contains the following tabs of monitors:
|
| Network Monitor |
The Network Monitor dashboard contains the following tabs of monitors:
|
|
The FortiView dashboard contains the following tabs of monitors:
|
|
| WiFi |
The WiFi dashboard is one tab that contains the following widgets:
|
See also Monitors and widgets and Widgets in VDOM mode.
You can edit predefined dashboards and add new dashboards of monitors and widgets. See Using dashboards of widgets and monitors.