FortiView monitors
FortiView monitors are available in the tree menu under Dashboards. The menu contains several default monitors for the top categories. Additional FortiView monitors are available as widgets that can be added to the dashboards. You can also add FortiView monitors directly to the tree menu with the Add (+) button.
Core FortiView monitors
The following default monitors are available in the tree menu:
|
Dashboard |
Usage |
|---|---|
|
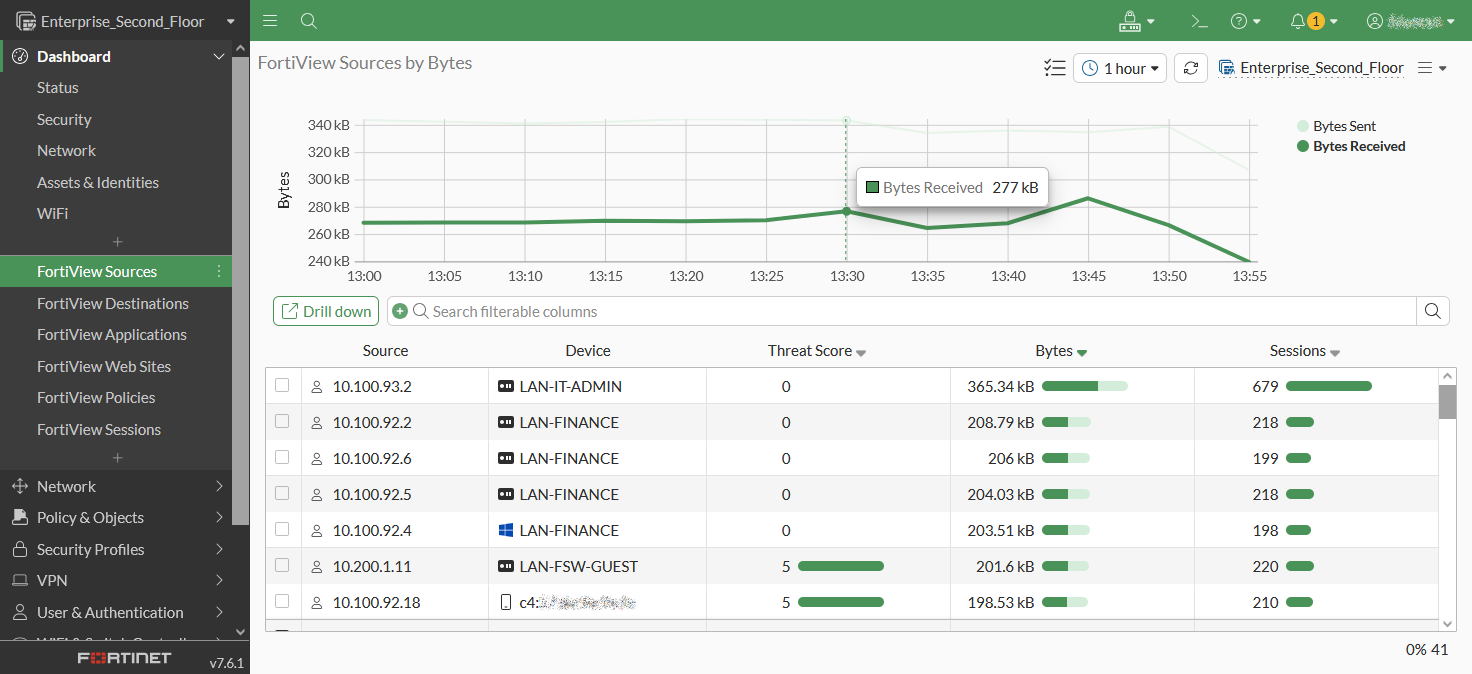
FortiView Sources |
Displays Top Sources by traffic volume and drilldown by Source. |
|
FortiView Destinations |
Displays Top Destinations by traffic volume and drilldown by Destination. |
|
FortiView Applications |
Displays Top Applications by traffic volume and drilldown by Application. |
|
FortiView Web Sites |
Displays Top Websites by session count and drilldown by Domain. |
|
FortiView Policies |
Displays Top Policies by traffic volume and drilldown by Policy number |
|
FortiView Sessions |
Displays Top Sessions by traffic source and can be used to end sessions. |
Usage is based on default settings. The pages may be customized further and sorted by other fields.
|
|
You can quarantine a host and ban an IP from all of the core FortiView monitors. |
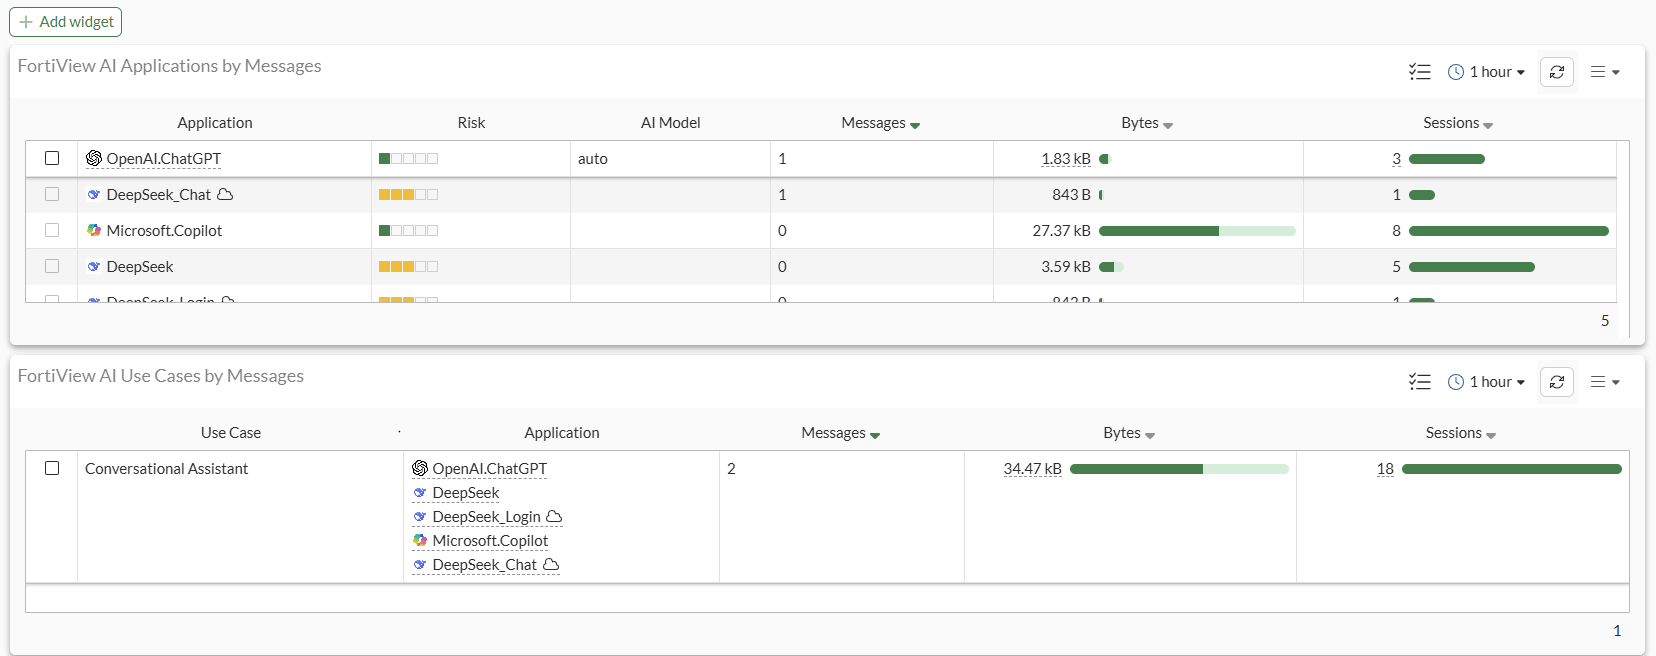
FortiView AI widgets NEW
Aggregated FortiView AI application information can be monitored in the FortiView AI Applications and FortiView AI Use Cases widgets:
-
The FortiView AI Applications widget displays top traffic sessions aggregated by AI application and includes information on Risk, AI model, Sessions, and so on. Selecting Drill Down on an Application will display specific information, such as Users, Use Cases, and Data Center Locations.
-
The FortiView AI Use Cases widget displays top traffic sessions aggregated by AI use case and includes information on Use Case, Application, Sessions, and so on. Selecting Drill Down on an Application will display specific information, such as Users, Applications, and Data Center Locations.