Status dashboard
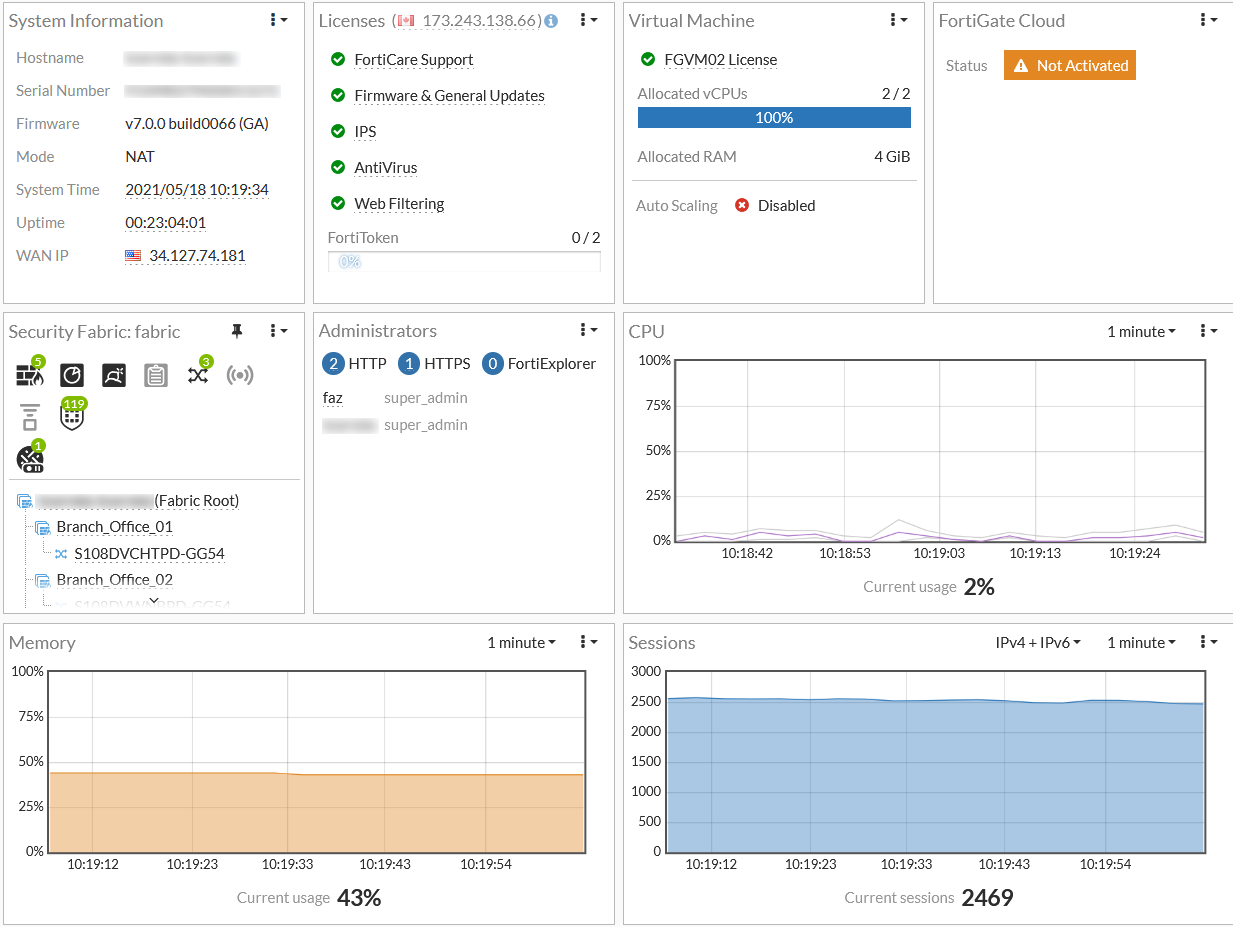
The Status dashboard provides an overview of your FortiGate device and the devices in your Security Fabric. If your FortiGate is a Virtual Machine, information about the Virtual Machine is also displayed in the dashboard.
Updating system information
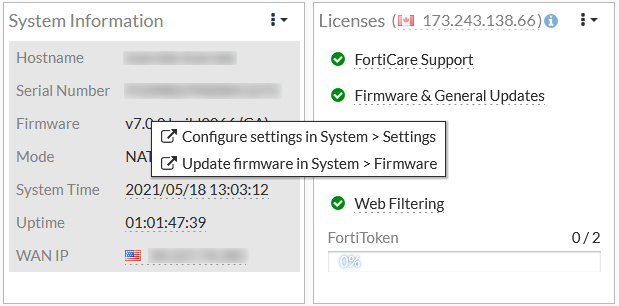
The System Information widget contains links to the Settings module where you can update the System Time, Uptime, and WAN IP.
A notification will appear in the Firmware field when a new version of FortiOS is released. Click Update firmware in System > Firmware to view the available versions and update FortiOS.
Viewing fabric devices
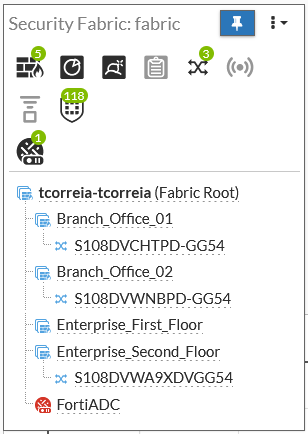
The Security Fabric widget provides a visual overview of the devices connected to the fabric and their connection status. Hover of a device icon to view more information about the device.
Click a device in the fabric to:
- View the device in the physical or logical topology
- Register, configure, deauthorize, or log in to the device
- Open Diagnostics and Tools
- View the FortiClient Monitor
These options will vary depending on the device.
Click Expand & Pin hidden content to view all the devices in the fabric at once.
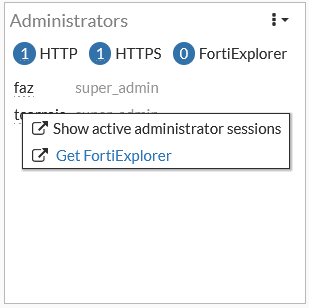
Viewing administrators
The Administrators widget displays the active administrators and their access interface. Click the username to view the Active Administrator Sessions monitor. You can use the monitor to end an administrator's session.
Resource widgets
The resource widgets show the current usage statistics for CPU, Memory, and Sessions.
Click the CPU monitor to show the per core CPU usage.

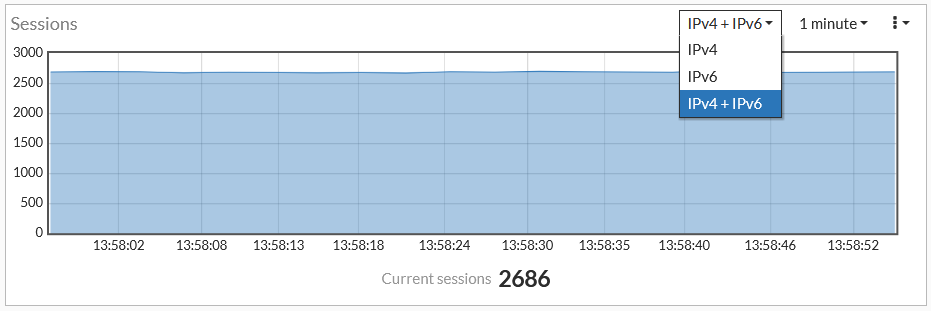
You can switch between IPv4, IPv6, or IPv4+IPv6 in the Sessions monitor.