Fortinet white logo
Fortinet white logo

Administration Guide

Using widgets

Using widgets

You can convert a widget to a standalone monitor, change the view type, configure tables, and filter data.

To save a dashboard widget as a monitor:
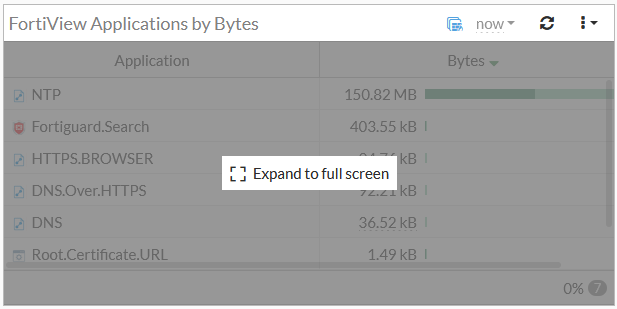
  1. Hover over the widget and click Expand to full screen.
    Note

    Full screen mode is not supported in all widgets.

  2. In the widget, click Save as Monitor. The Add Monitor window opens.

  3. (Optional) Enter a new name for the monitor in the Name field.
  4. Click OK.
To view the widget settings:
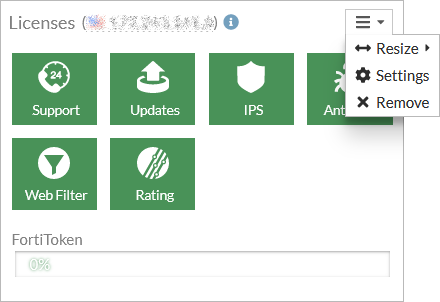
  1. Click the menu dropdown at the right side of the widget and select Settings.

  2. Configure the widget settings and click OK.
Note

The settings will vary depending on the widget.

To configure a table in the widget:
  1. Hover over the left side of the table header and click Configure Table.

  2. Configure the table options:
    OptionDescription
    Best Fit All ColumnsResizes all of the columns in a table to fit their content.
    Reset TableResets the table to the default view.
    Select ColumnsAdds or removes columns from the view.
  3. Click Apply.
To filter or configure a column in a table:
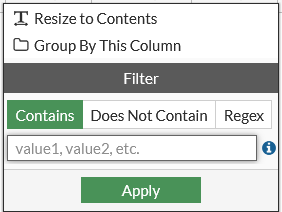
  1. Hover over a column heading, and click Filter/Configure Column.

  2. Configure the column options.

    Option

    Description

    Resize to ContentsResizes the column to fit the content.
    Group by this ColumnGroups the table rows by the contents in the selected column.

  3. Click Apply.
  4. To filter a column, enter a value in the Filter field, and click Apply.
Note

Filtering is not supported in all widgets.

Widgets

Dashboards are created per VDOM when VDOM mode is enabled. For information about VDOM mode, see Virtual Domains.

Note

Some dashboards and widgets are not available in Multi-VDOM mode.

The following table lists the available widgets in VDOM mode:

Category Widgets
FortiView
  • FortiView Application Bandwidth

  • FortiView Applications

  • FortiView Cloud Applications

  • FortiView Destination Interfaces

  • FortiView Destination Owners

  • FortiView Destinations

  • FortiView Policies

  • FortiView Proxy Destinations

  • FortiView Proxy Policies

  • FortiView Proxy Sessions

  • FortiView Proxy Sources

  • FortiView Sessions

  • FortiView Source Interfaces

  • FortiView Sources

  • FortiView VPN

  • FortiView Web Categories

  • FortiView Web Sites

  • FortiView ZTNA Servers

  • FortiView Countries/Regions

  • FortiView Destination Firewall Objects

  • FortiView Interface Pairs

  • FortiView Search Phrases

  • FortiView Servers

  • FortiView Source Firewall Objects

  • FortiView Sources - WAN

  • FortiView Traffic Shaping

Security Fabric
  • FortiGate Cloud

  • Security Fabric Status

Network
  • DHCP

  • DNS

  • Interface Bandwidth

  • IP Pool Utilization

  • IPsec

  • Load Balance

  • Routing

  • SD-WAN

  • SSL-VPN

  • Top IP Pools by Assigned IPs

Note

The Interface Bandwidth widget can monitor a maximum of 25 interfaces.

System
  • Administrators

  • Botnet Activity

  • HA Status

  • License Status

  • System Information

  • Top System Events

  • Virtual Machine

Resource Usage
  • CPU Usage

  • Disk Usage

  • Log Rate

  • Logs Sent

  • Memory Usage

  • Session Rate

  • Sessions

Security
  • Advanced Threat Protection Statistics

  • Assets - Vulnerabilities

  • Compromised Hosts

  • FortiSandbox Files

  • Quarantine

  • Top Endpoint Vulnerabilities

  • Top Failed Authentication

  • Top Threats

  • Top Threats - WAN

User & Authentication

  • Assets

  • Assets - FortiClient

  • Firewall Users

  • FortiGuard Quota

  • Identities

  • Matched NAC Devices

  • Top Admin Logins

  • Top Cloud Users

WiFi

  • Channel Utilization

  • Clients By FortiAP

  • FortiAP Status

  • Historical Clients

  • Interfering SSIDs

  • Login Failures

  • Rogue APs

  • Signal Strength

  • Top WiFi Clients

Using widgets

Using widgets

You can convert a widget to a standalone monitor, change the view type, configure tables, and filter data.

To save a dashboard widget as a monitor:
  1. Hover over the widget and click Expand to full screen.

    Note

    Full screen mode is not supported in all widgets.

  2. In the widget, click Save as Monitor. The Add Monitor window opens.

  3. (Optional) Enter a new name for the monitor in the Name field.
  4. Click OK.
To view the widget settings:
  1. Click the menu dropdown at the right side of the widget and select Settings.
  2. Configure the widget settings and click OK.
Note

The settings will vary depending on the widget.

To configure a table in the widget:
  1. Hover over the left side of the table header and click Configure Table.

  2. Configure the table options:
    OptionDescription
    Best Fit All ColumnsResizes all of the columns in a table to fit their content.
    Reset TableResets the table to the default view.
    Select ColumnsAdds or removes columns from the view.
  3. Click Apply.
To filter or configure a column in a table:
  1. Hover over a column heading, and click Filter/Configure Column.

  2. Configure the column options.

    Option

    Description

    Resize to ContentsResizes the column to fit the content.
    Group by this ColumnGroups the table rows by the contents in the selected column.
  3. Click Apply.
  4. To filter a column, enter a value in the Filter field, and click Apply.
Note

Filtering is not supported in all widgets.

Widgets

Dashboards are created per VDOM when VDOM mode is enabled. For information about VDOM mode, see Virtual Domains.

Note

Some dashboards and widgets are not available in Multi-VDOM mode.

The following table lists the available widgets in VDOM mode:

Category Widgets
FortiView
  • FortiView Application Bandwidth

  • FortiView Applications

  • FortiView Cloud Applications

  • FortiView Destination Interfaces

  • FortiView Destination Owners

  • FortiView Destinations

  • FortiView Policies

  • FortiView Proxy Destinations

  • FortiView Proxy Policies

  • FortiView Proxy Sessions

  • FortiView Proxy Sources

  • FortiView Sessions

  • FortiView Source Interfaces

  • FortiView Sources

  • FortiView VPN

  • FortiView Web Categories

  • FortiView Web Sites

  • FortiView ZTNA Servers

  • FortiView Countries/Regions

  • FortiView Destination Firewall Objects

  • FortiView Interface Pairs

  • FortiView Search Phrases

  • FortiView Servers

  • FortiView Source Firewall Objects

  • FortiView Sources - WAN

  • FortiView Traffic Shaping

Security Fabric
  • FortiGate Cloud

  • Security Fabric Status

Network
  • DHCP

  • DNS

  • Interface Bandwidth

  • IP Pool Utilization

  • IPsec

  • Load Balance

  • Routing

  • SD-WAN

  • SSL-VPN

  • Top IP Pools by Assigned IPs

Note

The Interface Bandwidth widget can monitor a maximum of 25 interfaces.

System
  • Administrators

  • Botnet Activity

  • HA Status

  • License Status

  • System Information

  • Top System Events

  • Virtual Machine

Resource Usage
  • CPU Usage

  • Disk Usage

  • Log Rate

  • Logs Sent

  • Memory Usage

  • Session Rate

  • Sessions

Security
  • Advanced Threat Protection Statistics

  • Assets - Vulnerabilities

  • Compromised Hosts

  • FortiSandbox Files

  • Quarantine

  • Top Endpoint Vulnerabilities

  • Top Failed Authentication

  • Top Threats

  • Top Threats - WAN

User & Authentication

  • Assets

  • Assets - FortiClient

  • Firewall Users

  • FortiGuard Quota

  • Identities

  • Matched NAC Devices

  • Top Admin Logins

  • Top Cloud Users

WiFi

  • Channel Utilization

  • Clients By FortiAP

  • FortiAP Status

  • Historical Clients

  • Interfering SSIDs

  • Login Failures

  • Rogue APs

  • Signal Strength

  • Top WiFi Clients