
Using widgets
You can convert a widget to a standalone monitor, change the view type, configure tables, and filter data.
To save a dashboard widget as a monitor:
- Hover over the widget and click Expand to full screen.


Full screen mode is not supported in all widgets.
- In the widget, click Save as Monitor. The Add Monitor window opens.

- (Optional) Enter a new name for the monitor in the Name field.
- Click OK.
To view the widget settings:
- Click the menu dropdown at the right side of the widget and select Settings.

- Configure the widget settings and click OK.
|
|
The settings will vary depending on the widget. |
To configure a table in the widget:
- Hover over the left side of the table header and click Configure Table.

- Configure the table options:
Option Description Best Fit All Columns Resizes all of the columns in a table to fit their content. Reset Table Resets the table to the default view. Select Columns Adds or removes columns from the view. - Click Apply.
To filter or configure a column in a table:
- Hover over a column heading, and click Filter/Configure Column.

- Configure the column options.
Option
Description
Resize to Contents Resizes the column to fit the content. Group by this Column Groups the table rows by the contents in the selected column. 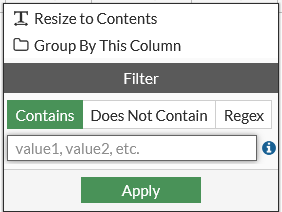
- Click Apply.
- To filter a column, enter a value in the Filter field, and click Apply.
|
|
Filtering is not supported in all widgets. |
Widgets
Dashboards are created per VDOM when VDOM mode is enabled.For information about VDOM mode, see Virtual Domains.
|
|
Some dashboards and widgets are not available in Multi-VDOM mode. |
The following table lists the available widgets in VDOM mode:
| Category | Widgets | ||
|---|---|---|---|
| FortiView |
|
||
| Security Fabric |
|
||
| Network |
|
||
| System |
|
||
| Resource Usage |
|
||
| Security |
|
||
|
User & Authentication |
|
||
|
WiFi |
|