
Enhanced Monitoring in Client Management Dashboard (8.0.0)
To provide more granular insights into client behavior over time, FortiWeb 8.0.0 introduces major enhancements to the Client Management dashboard. These updates allow administrators to observe not only real-time activity, but also behavioral trends—such as the current geo-location, device type, and request frequency.
In addition to redesigning the data presentation with both table and graph views, this enhancement introduces new visibility fields and filtering tools, making it easier to trace anomalous behavior and fine-tune mitigation thresholds. These improvements are especially useful when diagnosing false positives or identifying suspicious automation patterns.
New capabilities include:
-
Historical data for Geo Location and User Agent
-
Calculated average and peak request rates per client
-
A redesigned GUI that adds new filter types and a graphical FortiView display
These capabilities significantly improve the usability of Client Management as a monitoring, investigative, and policy-tuning tool.
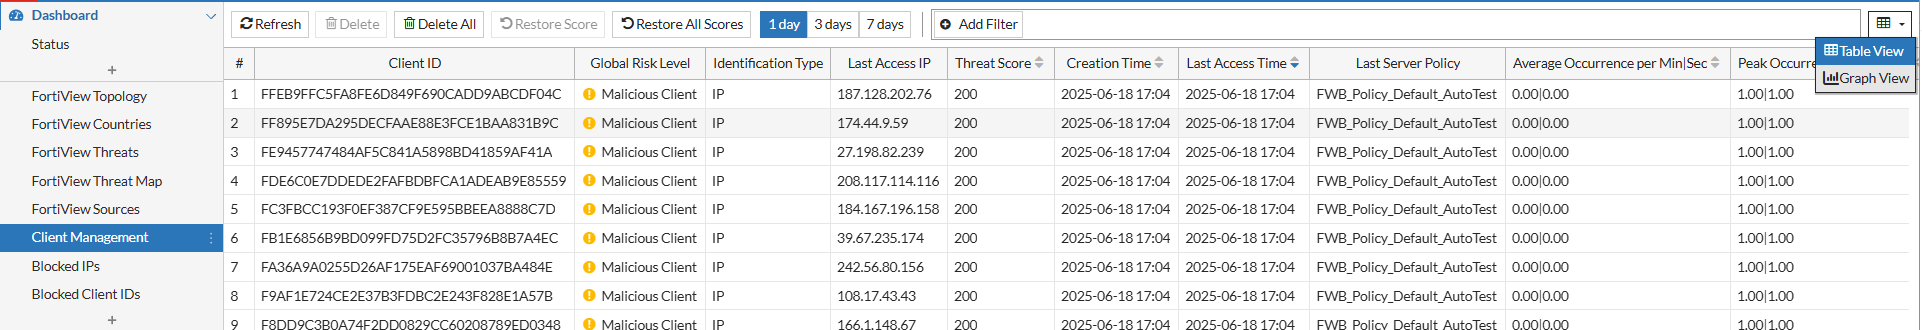
Table View
The Table View provides a detailed breakdown of every tracked client, correlating real-time and historical data to help identify threat patterns, client anomalies, and detection performance. Each row represents a unique client, indexed by Client ID, and includes metadata that reflects the client’s behavioral profile and risk level.
Columns
The updated dashboard table now displays the following columns for each tracked client:
|
Column Name |
Description |
|---|---|
| # | Index number for the client record. |
| Client ID | Unique identifier assigned to the client. |
| Global Risk Level | Current threat classification level based on observed behavior. |
| Identification Type | Method used to identify the client (e.g., IP, cookie-based ID). |
| Last Access IP | Most recent source IP address associated with the client. |
| Threat Score | Cumulative threat score based on matched detection criteria. |
|
Signature Score |
Reflects the cumulative threat score based on signature violations associated with the Client ID. This column is hidden by default. |
| Creation Time | Timestamp when the client ID was first recorded. |
|
Last Access Time (new) |
Most recent timestamp of any activity from this client. |
|
Last Server Policy (new) |
The last server policy accessed by this client. |
|
Average Occurrence per Min|Sec (new) |
Moving average of how frequently the client has sent requests, calculated separately for each time scale using recent traffic data. Useful for establishing normal behavioral baselines. |
|
Peak Occurrence per Min|Sec (new) |
Highest recorded number of requests from the client in a single minute or second. Useful for identifying sudden request bursts or scripted behavior. |
|
Geo Location (new) |
Current country associated with the client. |
| User Agent (new) | Current user-agent strings and types. |
Filters
The legacy client search mechanism has been replaced by a structured filter panel that allows administrators to refine results using:
-
Client ID
-
Geo Location
-
Global Risk Level
-
Identification Type
-
Last Server Policy
-
User Agent
These filters support targeted traffic analysis across specific clients, policies, or threat types.
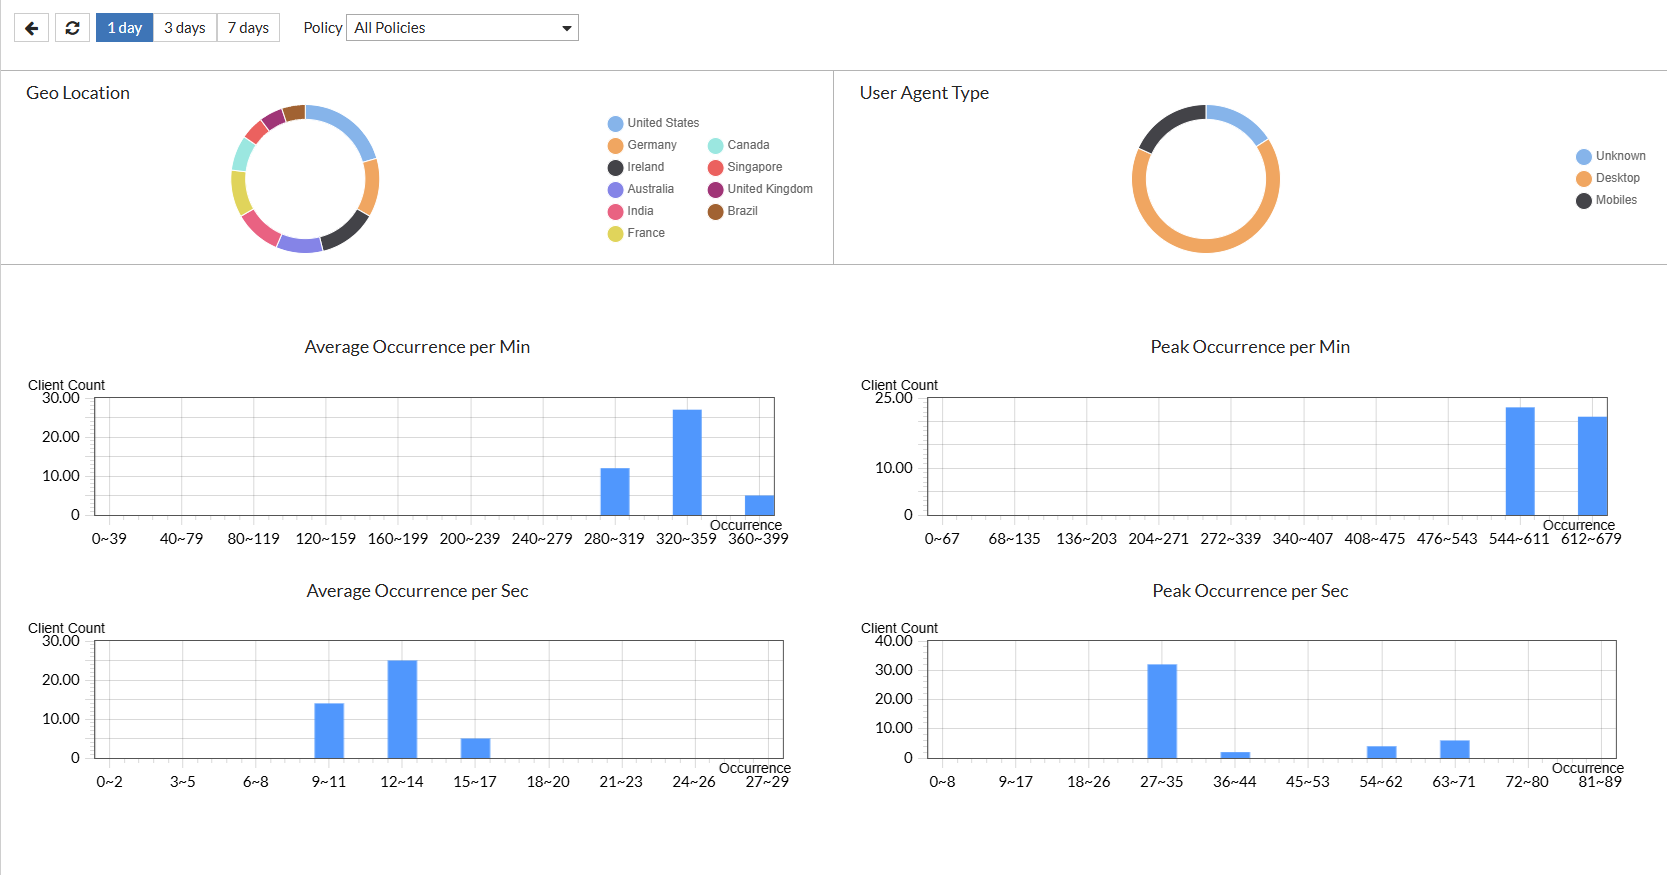
Graph View: FortiView Client Analytics
A new Graph View is now available in the Client Management Monitor interface. This mode provides visual insights into aggregate client activity trends and anomalies across the environment.
Visualizations
|
Category |
Visualization Type |
Description |
|---|---|---|
| Geo Location | Pie chart | Shows the geographic distribution of clients based on the most recent location data. Shows the top 10 countries |
|
User Agent Type |
Pie chart |
Displays the distribution of user agent types, categorized as Desktop, Mobile, or Unrecognized. |
| Average Occurrence per Min | Bar chart | Displays the total number of clients found in the range of the occurrence frequency (per minute). This helps identify typical request frequency across clients over one-minute windows. |
| Average Occurrence per Sec | Bar chart | Displays the total number of clients found in the range of the occurrence frequency (per second). High values may indicate scripted or automated behavior. |
| Peak Occurrence per Min | Bar chart | Displays the highest request spikes per client found in the range of the occurrence frequency (per minute). This is useful for flagging potential DDoS-like behavior. |
| Peak Occurrence per Sec | Bar chart | Displays the highest request spikes per client found in the range of the occurrence frequency (per second). This helps detect sudden, high-intensity request bursts at the subminute level. |
These visual tools support quick identification of outliers, scripted traffic, or emerging patterns that might not be obvious from raw tabular data alone.