Client-Side Protection
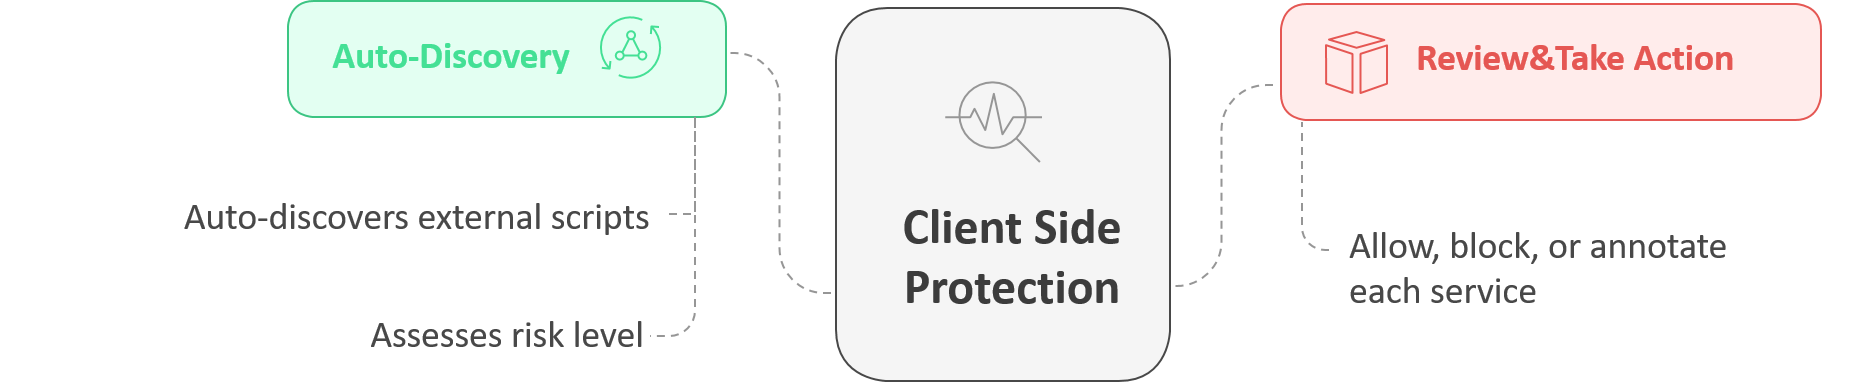
FortiWeb’s Client-Side Protection is specifically designed to help you monitor and control third-party scripts and services loaded in your web application. It analyzes your front-end code and automatically identifies all external services and domains involved.
With Client-Side Protection, you can monitor the types of content retrieved from external services, assess the risk level of each script, check whether the connections are encrypted, and see how frequently they are loaded by clients. Based on this information, you can choose to allow, block, or annotate each service—enabling you to build a precise and secure Content-Security-Policy (CSP) that minimizes exposure to untrusted sources.
|
|
A valid license for the Client-Side Protection service is required. Without a license, the module cannot be configured through either the GUI or CLI. |
This page includes a technical overview of how the feature works, followed by configuration steps and guidance on monitoring protected sites. If you are already familiar with the concept, you can jump ahead to:
How It Works
FortiWeb enforces client-side security by injecting a lightweight JavaScript collector into eligible HTTP responses. Running directly in the browser, this collector captures telemetry on real-time activity, including:
-
Execution of unauthorized or injected JavaScript
-
Document Object Model (DOM) modifications and dynamic element insertion
-
Credential field access or manipulation
-
Third-party resource loading and origin mismatches
This enables FortiWeb to observe threats that emerge after page load—threats that bypass traditional perimeter and server-side defenses.
For environments with strict compliance or script injection restrictions, administrators can enable Passive Assessment. Instead of injecting scripts, FortiWeb inspects returned HTML for high-risk elements such as <script>, <iframe>, and <form> to detect unauthorized or manipulated third-party content.
Telemetry collected from either method is analyzed by FortiWeb in real time. Administrators can configure one of two protection modes:
-
Monitor: Logs policy violations and browser-reported events without enforcing blocks to clients outside the Collect IP Range.
-
Block: Enforces client-side security through a strict
Content-Security-Policyheader and Subresource Integrity (SRI) checks, actively preventing untrusted behavior in the browser.
Configuring a Client-Side Protection Policy
Client-Side Protection is policy-based and can be scoped to specific hosts, URLs, or client IP ranges. Each policy defines how FortiWeb should monitor or block script activity and which mechanisms it should use to collect data.
To configure a Client-Side Protection Policy:
-
Go to Web Protection > Client Side Security > Client Side Protection.
-
Click Create New to display the configuration editor.
-
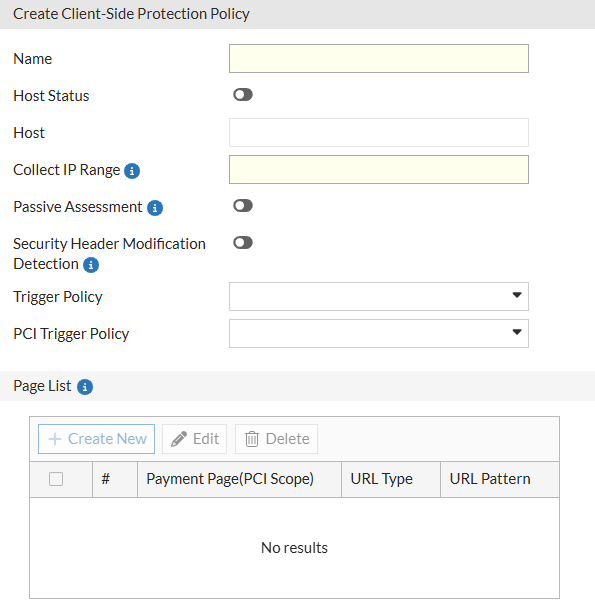
Configure the following settings:
Setting
Description
Name Enter a name for the policy. Host Status Enable to apply the policy only to requests for a specific host. Useful in multi-tenant or multi-site deployments. This is disabled by default. Host Define the hostname to match when Host Status is enabled. Collect IP Range Define a set of client IP addresses from which JavaScript activity will be collected. In Monitor mode, only clients in this range will trigger data collection and enforcement logic. Passive Assessment Enable passive HTML analysis of script and resource elements (e.g.,
<script>,<iframe>,<form>) to identify unauthorized or modified third-party content without relying on JavaScript injection.This is disabled by default.
Security Header Modification Detection
Enable this to monitor and log instances where browser security headers (such as Content Security Policy or Strict-Transport-Security) are modified or stripped by client-side scripts or browser extensions.
Trigger Policy
Select a Trigger Policy to define the logging and notification actions taken when a general client-side violation (e.g., a suspicious domain or unauthorized script) is detected.
PCI Trigger Policy
Select a specific PCI Trigger Policy to handle violations detected on pages defined within the PCI Scope. This allows for stricter logging or blocking actions specifically for payment-related pages.
-
Click OK to save the policy.
-
After the policy is saved, the Page List section becomes configurable. Defining pages here allows you to apply granular monitoring to specific application paths rather than the entire host.
Under the Page List, click Create New to add entries and configure the following:
Setting
Description
URL Type Specify the URL matching method:
-
Simple String – Exact match with a static path.
-
Regular Expression – Pattern match with regex syntax.
Simple String is the default option.
URL Pattern Enter the URL or pattern to target for monitoring. Payment Page (PCI Scope) Enable to explicitly mark the URL as a payment page. This is a critical requirement for PCI DSS 4.0 (Requirement 6.4.3 and 11.6.1), as it instructs FortiWeb to:
-
Apply the stricter PCI Trigger Policy to any script activity on this page.
-
Inventory all JavaScript executing on the page for compliance audits.
-
Generate alerts for unauthorized script modifications specifically on cardholder data entry points.
-
-
Once you've configured the Page List, click OK to apply the updates to the policy.
After creating the Client-Side Protection policy, assign it to an inline Web Protection Profile and apply that profile to the appropriate Server Policy. For the protection to take effect, the Web Protection Profile must also include both an HTTP Header Security policy and a Subresource Integrity policy. Once traffic is processed through the Server Policy, FortiWeb begins collecting response data in real time, enabling administrators to monitor and manage client-side activity from the Client Side Protection page.
Using the Client-Side Protection Dashboard
Once deployed, Client-Side Protection generates real-time visibility into browser-side behavior for each protected host. The dashboard view enables administrators to analyze third-party script usage, manage policy actions, and fine-tune content security enforcement.
This centralized interface acts as the command center for transitioning your application from a Monitor (Report-Only) state to an Enforcement (Block) posture. It utilizes three collection layers to monitor execution, DOM modifications, and header integrity:
-
Layer 1: CSP-Collector: Overrides HTTP headers to inject either
content-security-policy-report-only(Monitor) orcontent-security-policy(Block). -
Layer 2: JS-Collector: Injects a lightweight
js_collector.jsfile into eligible HTTP responses to observe runtime behaviors like unauthorized script execution or credential field access. -
Layer 3: Passive-Collector: Parses returned HTML to identify high-risk elements such as
<script>,<iframe>, and<form>without relying on JavaScript injection.
While providing broad protection against supply-chain attacks like formjacking, the dashboard also includes specialized modules designed to satisfy the inventory, justification, and tamper-detection mandates of PCI DSS 4.0.1.
The dashboard is divided into five specialized tabs:
-
Overview: Summarizes the protection posture for selected hosts, manages CSP header injection, and visualizes violation trends reported by the client browser.
-
Discovered Scripts: A resource-focused inventory of every first-party and third-party script detected. This tab tracks specific versions via cryptographic hashes and provides behavioral insights such as DOM Access, Data Access, and Script Function Execution.
-
PCI Compliance: An audit-ready view specifically mapped to PCI DSS 4.0.1 requirements 6.4.3 and 11.6.1. It streamlines the management of payment page scripts by identifying new versions, newly discovered resources, and scripts lacking mandatory business justifications.
-
Security Headers: Monitors the integrity of security-impacting HTTP headers. It compares the Expected Value (configured in FortiWeb) against the Observed Value (collected from the client browser) to detect unauthorized deletions or modifications.
-
Alert Center: A centralized repository for significant security logs. Events are categorized into three main types: Resource (New Hash, New Insight, Broken Link), HTTP Security Header (anomalies), and JS Collector Injection (operational issues).
Launching the Dashboard
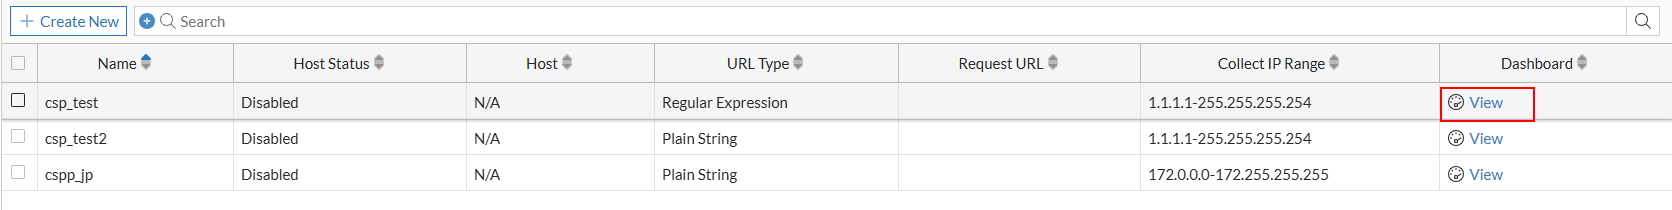
You can access the dashboard once a Client-Side Protection policy is active and processing traffic.
-
Go to Web Protection > Client Side Security > Client Side Protection.
-
Locate the policy you want to inspect.
-
Access the dashboard using either of the following methods:
-
Click View in the Dashboard column.
-
Select the policy to expand its row, then click View Dashboard from the available actions.
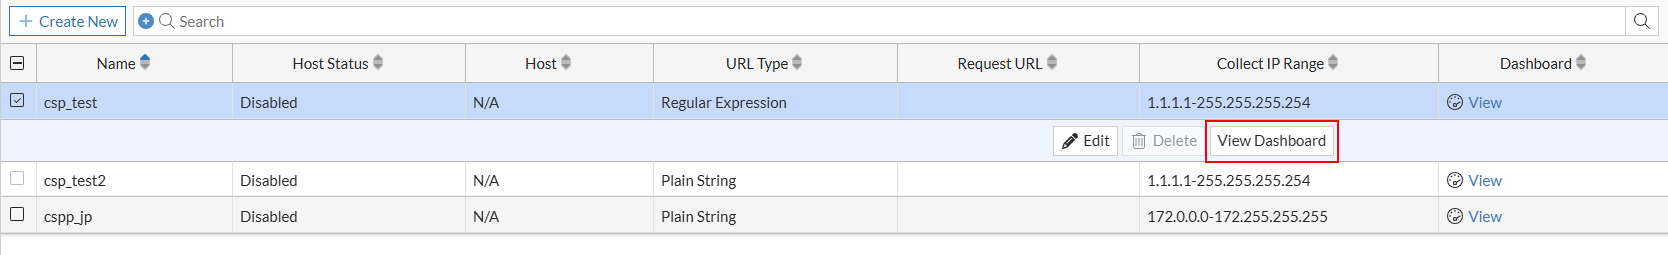
-
Overview
The Overview page serves as the entry point for Client-Side Protection. It retains the high-level, service-oriented view available in earlier releases, allowing administrators to see which external services are being used, their associated risk levels, and their current allow/block status.
Data is populated based on live traffic that passes through Server Policies using a Web Protection Profile that includes the Client-Side Protection policy.
The page contains three functional panels:
Host Selection and Protection Mode
At the top of the dashboard, FortiWeb displays a list of hosts (domains) associated with the selected Client-Side Protection policy. These are derived from Server Policies that reference a Web Protection Profile containing this policy.

Elements Displayed:
-
Host dropdown: Lists hostnames currently protected by the policy.
-
Protection Mode toggle:
-
Monitor mode:
-
The
Content-Security-Policy-Report-Onlyheader is inserted. -
Runtime actions such as script blocking and integrity enforcement apply only to clients in the defined Collect IP Range.
-
-
Block mode:
-
The
Content-Security-Policyheader is enforced for all clients. -
All defined blocking and Subresource Integrity (SRI) actions apply globally.
-
-
When switching to Block mode, header injection and enforcement behavior defined in the Client-Side Protection policy override any overlapping rules in the HTTP Header Security and Subresource Integrity Policy modules.
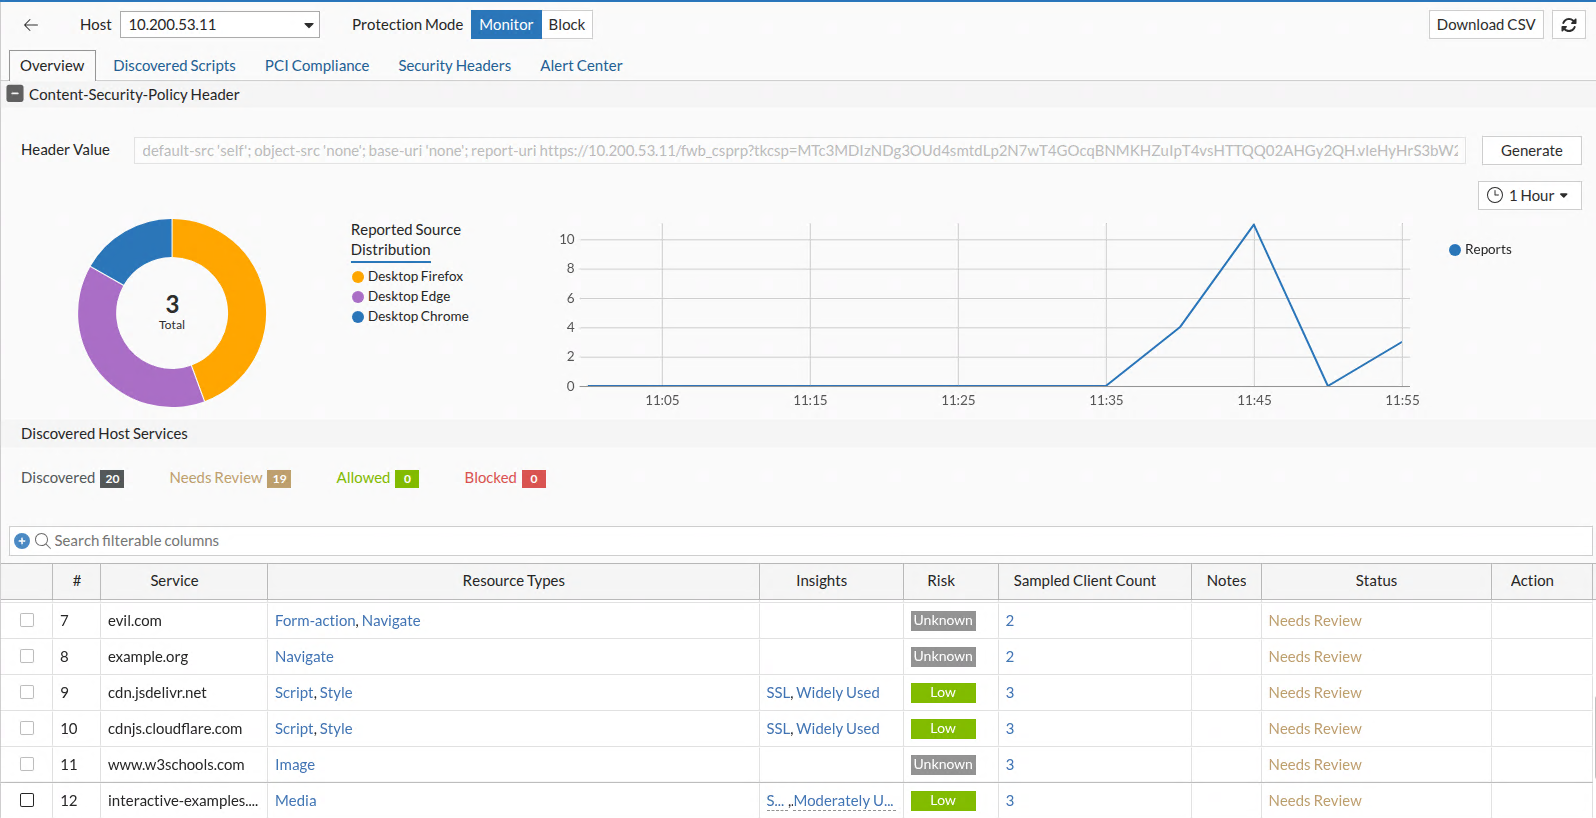
Content-Security-Policy Header
This panel displays and manages the Content-Security-Policy or Content-Security-Policy-Report-Only header applied to responses for the selected host. This header instructs browsers which sources are allowed for scripts, styles, media, and other content types, enabling enforcement of strong client-side security controls.
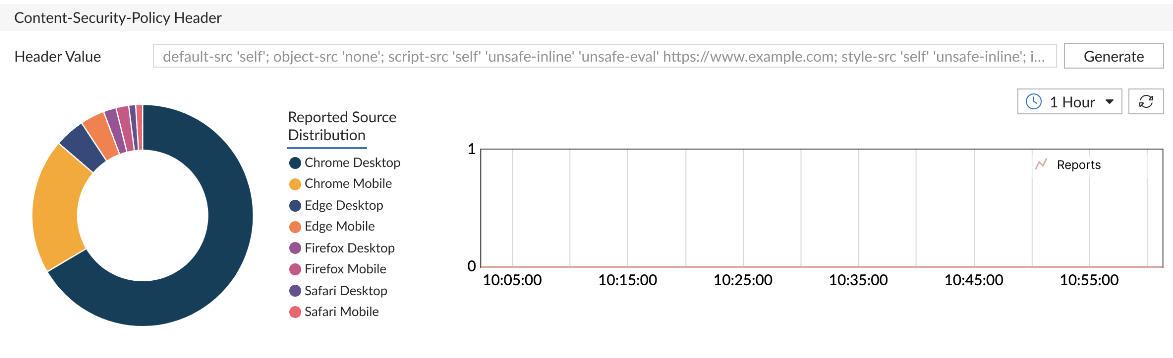
Displayed Components:
-
Header Value: Shows the current Content-Security-Policy string injected by FortiWeb. This value is calculated based on allowed services, resource inventory, and administrator-defined overrides.
-
Browser Distribution Pie Chart: Summarizes which browser types have submitted violation reports (e.g., Chrome, Firefox, Safari), helping validate policy propagation.
-
Report Trend Graph: Plots the volume of Content-Security-Policy violation reports over time to help identify configuration gaps or unauthorized resource behavior.
Available Actions:
-
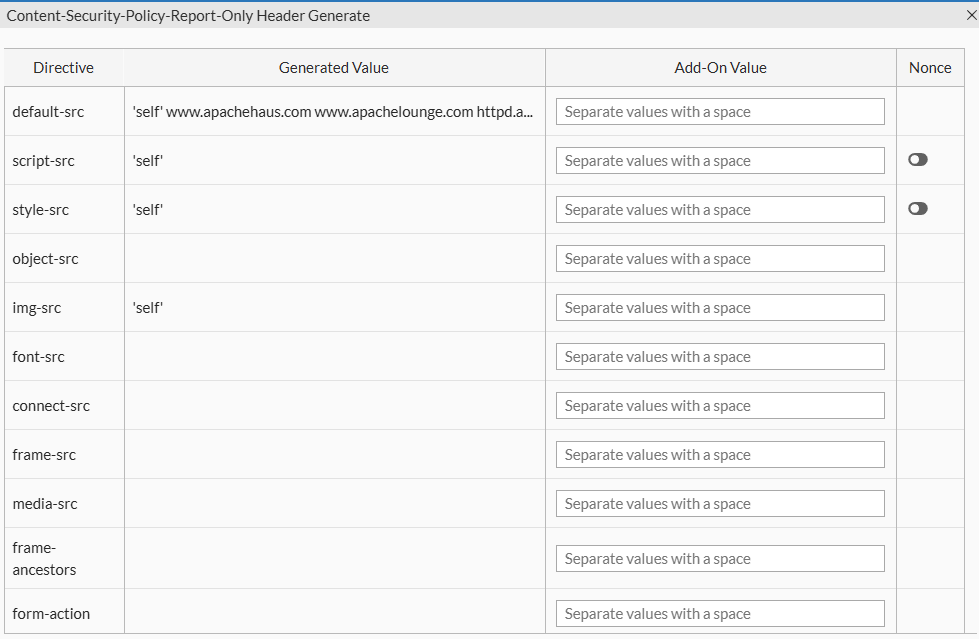
Generate: Opens a dialog that allows administrators to:
-
Generated Value: Read-only field displaying the system-generated Content-Security-Policy header based on current allow/block actions and discovered services.
-
Add-On Value: Optional field where administrators can manually append custom source directives. This supports both host-based and keyword-based sources.
Value Reference:
Source Type
Examples / Description
Host Source Use patterns such as *.example.com,www.example.com/x.js,https://www.example.com:8443, or IP addresses like192.168.1.100to explicitly allow trusted sources.'self'Allows content from the current origin. 'none'Disallows all sources for the directive. 'unsafe-inline'Permits inline scripts or styles; not recommended due to XSS risk. 'unsafe-eval'Allows use of eval(),new Function(), and string-based timers; introduces exploitability.'report-sample'Enables the browser to include a truncated portion (up to 40 characters) of the violating payload in reports. 'strict-dynamic'Allows dynamically added scripts to be trusted if the original script was loaded using a nonceorhash. -
Nonce Toggle: Inserts a nonce directive into the Content-Security-Policy header. FortiWeb automatically generates a unique nonce per response to enable safe inline script execution.
-
Validation and Save: FortiWeb validates the complete Content-Security-Policy string for syntax correctness before saving. Errors and warnings are surfaced in the interface with severity indicators.
-
-
Download CSV: Exports a list of current service states, header directives, and client report metadata.
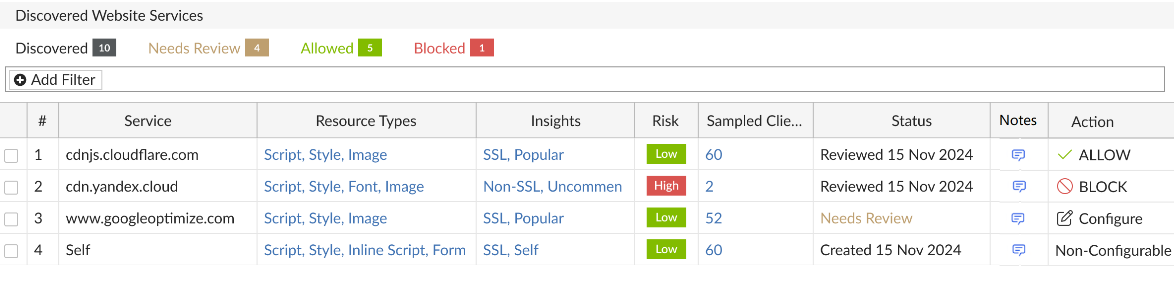
Discovered Host Services
The Discovered Host Services panel lists all third-party services detected in browser responses for the selected host. Each row represents a unique external origin that has served one or more frontend resources (e.g., scripts, styles, images) either dynamically or through static HTML.
This panel is the entry point for service-level policy decisions. Users can allow, block, or review each domain based on security assessment, business context, or observed behavior.
Service Discovery Methods
FortiWeb identifies and monitors client-side activity using three complementary discovery methods:
-
Browser Report: Leverages browser-native reporting through the
Content-Security-Policy-Report-Onlyheader to collect violation feedback directly from the client. -
JS Monitor: Injects a lightweight JavaScript collector (
js-collector) into eligible HTTP responses to observe runtime behaviors such as unauthorized script execution, credential field access, and DOM manipulation. -
Passive Detector: Analyzes returned HTML content without script injection. This method scans for
<script>,<iframe>,<form>, and other potentially risky elements and external resource references—ideal for deployments with strict compliance requirements.
These mechanisms can operate individually or together depending on the protection mode and policy configuration, allowing administrators to balance visibility, enforcement, and compliance.
Displayed Fields:
|
Column |
Description |
|---|---|
| Service | Fully qualified domain name of the third-party origin. This includes CDN endpoints, analytics vendors, embedded services, and cross-origin API calls. |
| Resource Types | Categories of resources retrieved from this origin (e.g., Script, Style, Image, Iframe, Data). Click to view a detailed list of all discovered resources, with per-resource control. |
| Insights |
Displays contextual metadata such as service type (e.g., Analytics, CDN, Ad Network), observed behavior, and traffic volume classification. Click to open a pop-up with full insight data. |
| Risk |
Security risk score derived from behavioral analysis and threat intelligence. Reflects exposure potential or history of malicious use. |
| Sampled Client Count |
Number of unique clients that accessed or reported this service. Click to open a detailed client session report with browser type, last report timestamp, and data source (Content-Security-Policy vs. JS). |
| Notes | Admin-defined comments. Use to document rationale for allow/block actions or provide audit context. Editable in place. |
|
Status |
Displays the current review status:
|
|
Action |
Shows the applied enforcement action. Click to configure. Options:
Batch actions available through multi-select. |
Interacting with Discovered Services
The Discovered Host Services table allows users to drill down into service-level data, manage enforcement actions, and document decisions. Several fields support interactive inspection, offering direct access to deeper behavioral context or resource-level control.
Inspecting Service Details
-
Resource Types
Click to open the Resource Inventory and Actions dialog. This view lists all resources loaded from the selected service—such as JavaScript files, stylesheets, and images—and allows users to apply Subresource Integrity (SRI) or Block actions on a per-resource basis.
-
Insights and Risk
Click either field to open a detailed information panel about the service.
This includes:-
Service classification (e.g., Tracking, CDN, Embedded UI)
-
Risk indicators, such as known abuse history, suspicious behavior, or overbroad access patterns
-
Usage metrics, including frequency, client reach, and geographic distribution
-
-
Sample Clients
Click to view session-level reporting data for the selected service. Use this data to differentiate between services accessed consistently by many clients and those triggered only in isolated sessions—an important indicator when identifying anomalous or potentially malicious resources.
The report includes:-
IP addresses or Client IDs
-
Browser types and versions
-
Number of reports received, categorized by JavaScript collector and Content-Security-Policy violation
-
Timestamp of the most recent interaction
-
Notes and Status Tracking
-
Notes
This column supports editable text for administrative documentation. Use notes to capture review rationale, exception handling, or cross-team communication about a service's policy status.
-
Status
The status field updates automatically when an action is applied. A new service appears as Needs Review, and changes to Allowed or Blocked once a decision is made. Although status does not affect enforcement directly, it provides useful tracking for environments with frequent third-party changes or collaborative review workflows.
Managing Services in Bulk
Multiple services can be selected using checkboxes in the table. With one or more entries selected, use the Configure menu to apply actions in bulk:
-
Set selected services to Allow or Block
-
Reset selected rows to Needs Review
-
Export selected entries to CSV for offline audit or reporting
Bulk operations are particularly useful when onboarding new tag managers, integrating with A/B testing frameworks, or enforcing a default-deny posture for unknown domains.
Enforcement Behavior
Decisions made in the Discovered Host Services table directly influence how FortiWeb enforces client-side protections:
-
If HTTP Header Security is enabled, allowed services are added to the
Content-Security-Policyheader; blocked services are excluded. -
If the JavaScript collector is active, blocked services are enforced at runtime through injected instrumentation.
-
If a Subresource Integrity Policy is enabled, services with an SRI action will have the corresponding
integrityattribute injected into their HTML tags to ensure browser-side validation. -
If only Passive Detector and Subresource Integrity Policy are enabled, FortiWeb removes blocked services from the response HTML before it reaches the browser.
When the same service or resource is defined in both the Client-Side Protection dashboard and a separate Subresource Integrity or HTTP Header Security policy, the Client-Side Protection settings take precedence.
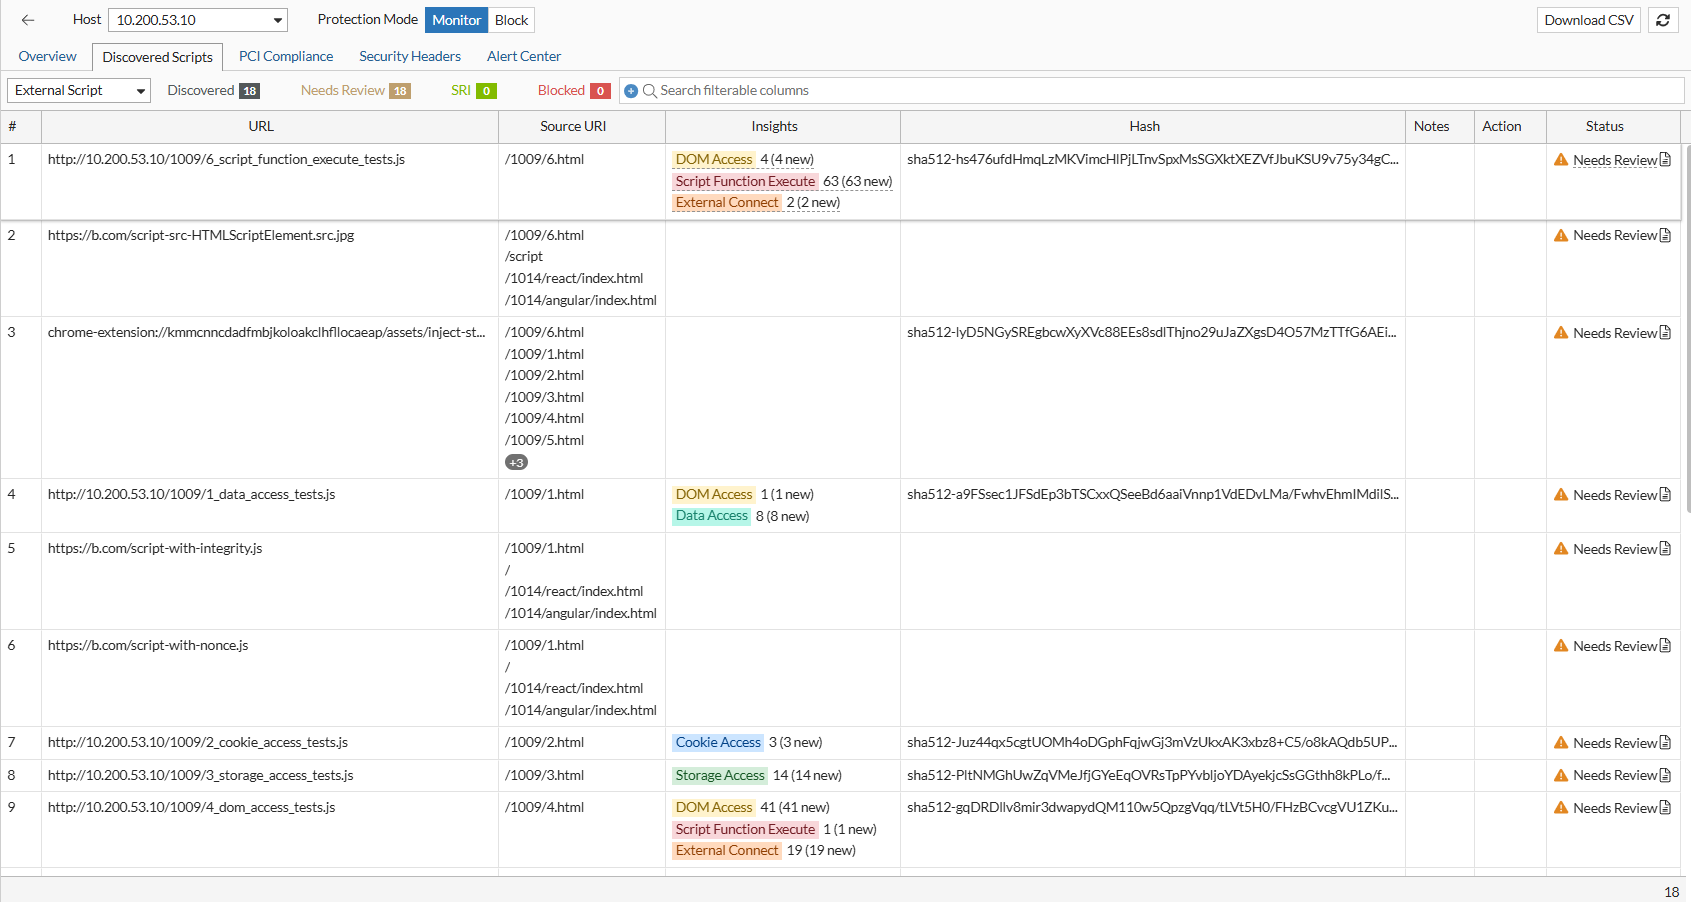
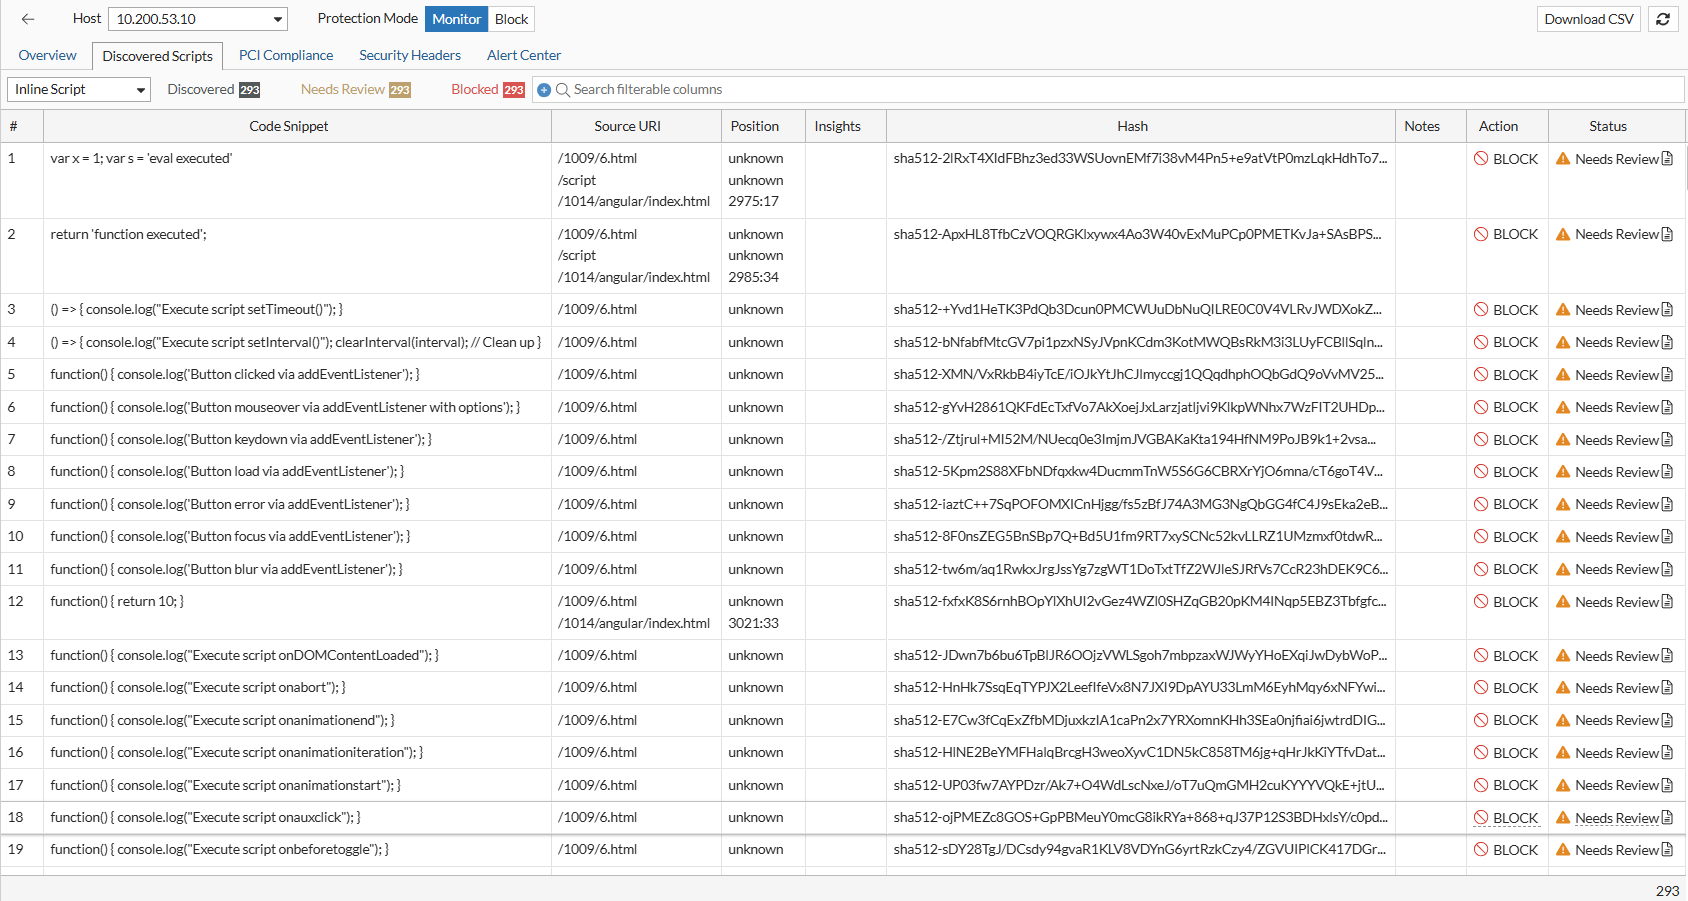
Discovered Scripts
The Discovered Scripts page introduces a unified interface for viewing all script resources identified on protected pages. Both external and inline scripts are listed with expanded metadata such as source page location, insights observed by the JS Collector, hash and version history, and indicators for new scripts, new versions, or newly detected behavior. Inline scripts now include precise line-number positions within the HTML source and support per-script block and unblock actions. Review operations such as applying SRI, editing notes, and marking a script as reviewed are performed directly within this page, creating a central workspace for managing script integrity and behavior.
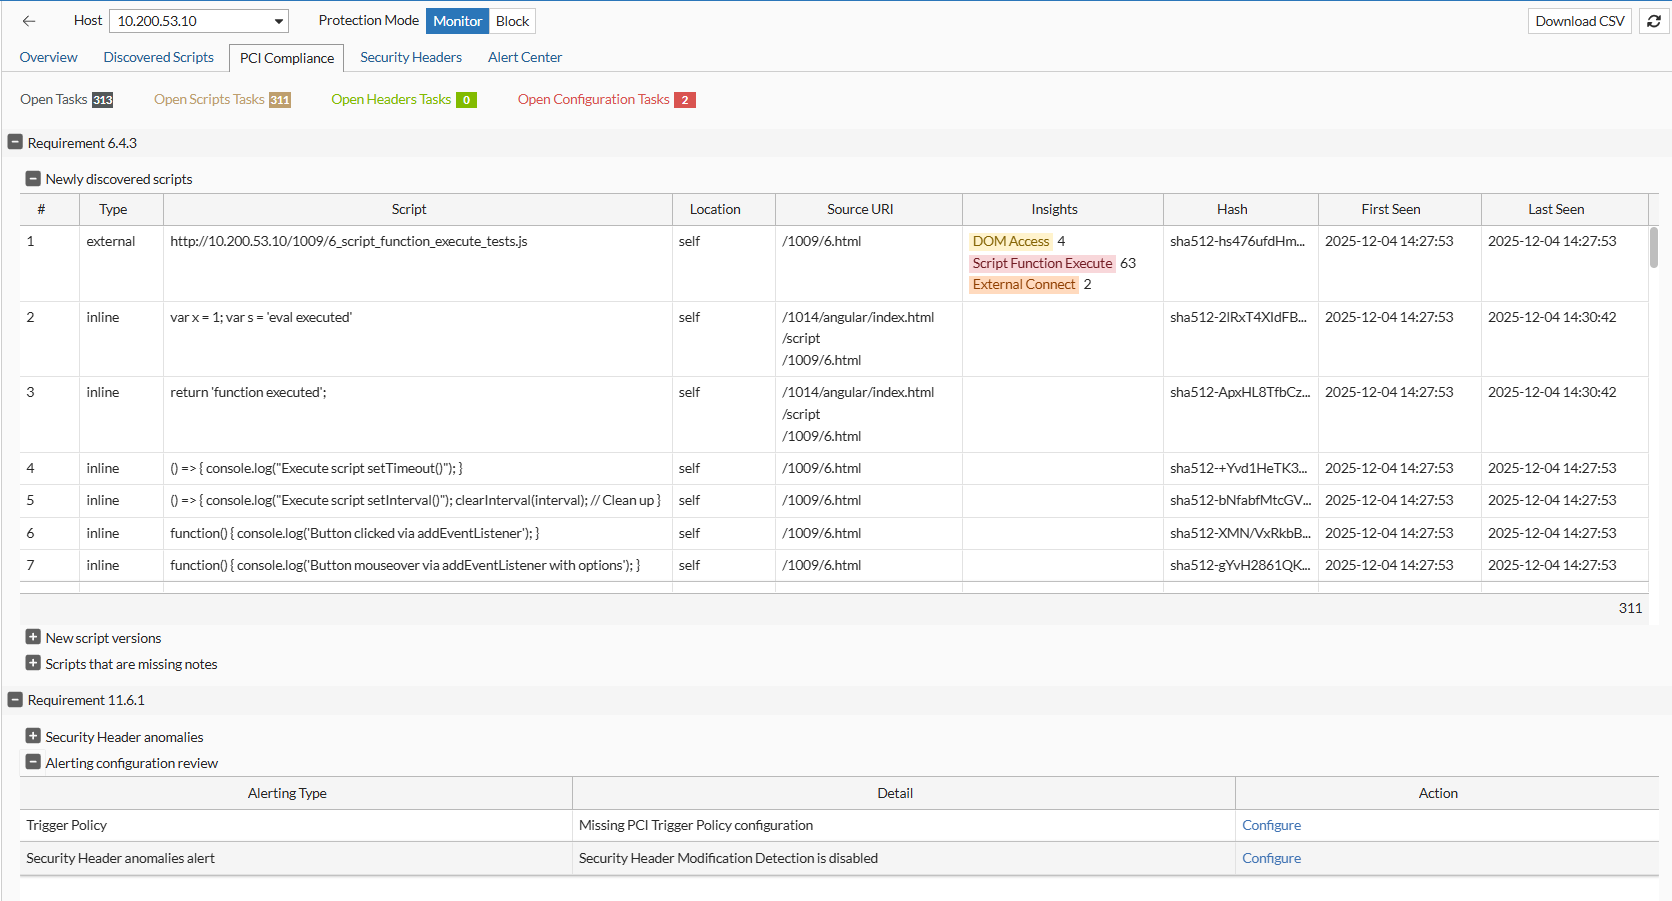
PCI Compliance
A new PCI Compliance page supports organizations subject to PCI DSS 4.0.1 requirements. Findings collected from the browser are grouped according to the tasks defined in PCI DSS requirements 6.4.3 and 11.6.1, including newly discovered scripts, new script versions, missing notes, security header anomalies, and alert configuration issues. Administrators can configure payment page scope within the Client-Side Protection policy and complete review actions with required notes to ensure proper documentation for audit reporting. A downloadable CSV is available for exporting the full review and change history associated with payment pages.
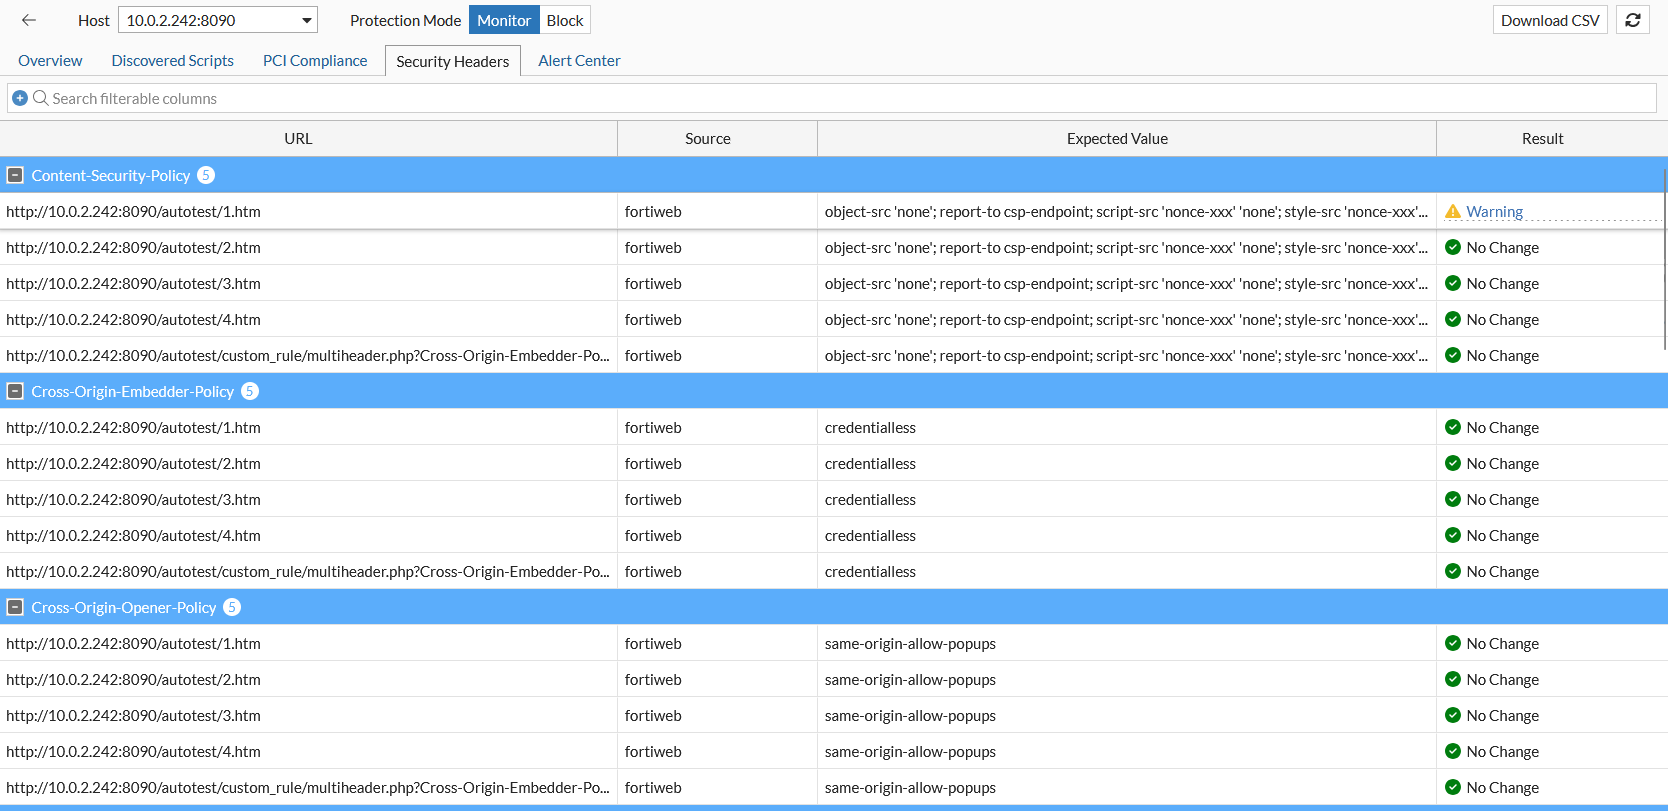
Security Headers
The Security Headers page reports discrepancies between expected security headers and those observed in the browser. Using values collected by the JS Collector, FortiWeb identifies missing, modified, or unexpected headers for items such as Content-Security-Policy, Referrer-Policy, Permissions-Policy, HSTS, and others. Each finding is displayed for review, allowing administrators to evaluate potential client-side manipulation. This page also supports PCI DSS requirement 11.6.1 by highlighting unauthorized modifications to security-impacting headers.
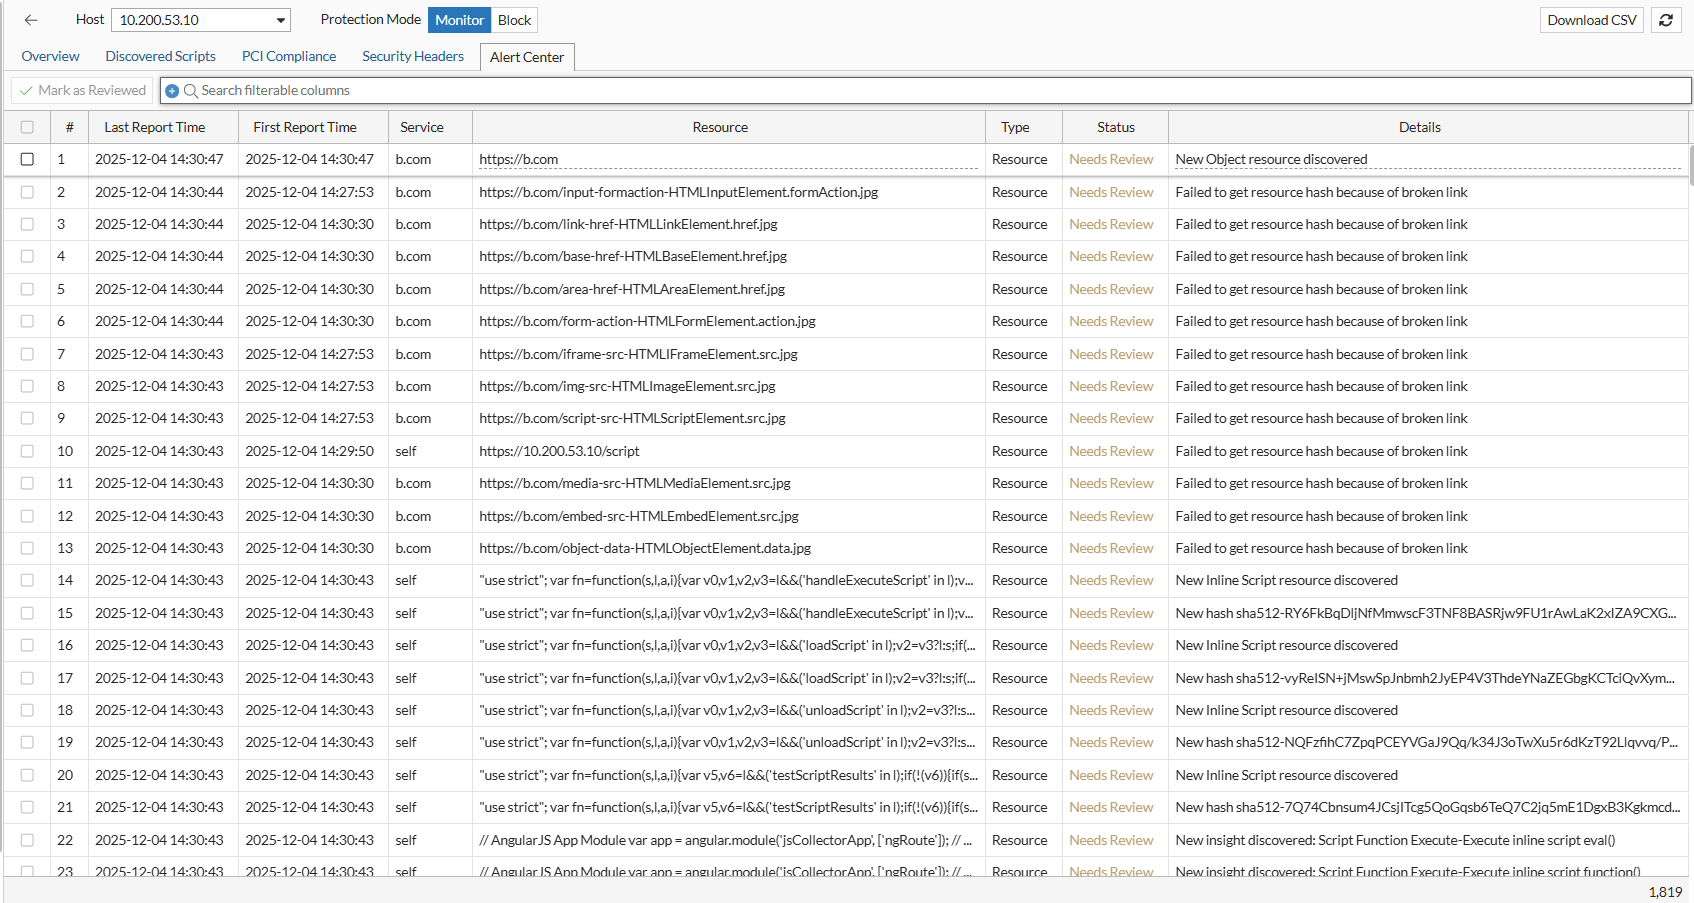
Alert Center
The Alert Center provides a centralized view of Client-Side Protection-related events detected by FortiWeb. It aggregates information such as newly discovered resources, hash or integrity changes, broken links, new insights, JS injection failures, and security header modification failures. Alerts include timestamps, resource URL, and contextual details, and administrators can filter and review entries directly within the page. This unified alert view improves situational awareness and helps identify client-side anomalies that may indicate tampering or compromised external resources.