
Entity Panel
The Entity Panel provides contextual information about specific identifiers, known as entities, to aid in security analysis. The entities currently supported are IP addresses and domains. Entities are extracted from event data and stored in their own data store. The Entity Panel displays all contextual information collected for an entity, drawing data from both within and outside the network.
The Entity Panel supports investigations and threat hunting by consolidating data types, providing historical context, external intelligence, and relevant network activity related to the entity.
To access the Entity Panel:
- Left-click any entity (such as an IP address) anywhere in the portal.
- Click an IP address in the detector details tabs.
- Click View Device Details in the Actions menu.
- Click a device IP in the High Risk Devices dashboard widget.
- Click the IP label on the Detections Device Timeline.
The Entity Panel is organized into tabs on the right side of the page, providing focused views of the gathered data:
- Tabs: Display contextual and activity information, along with external threat intelligence and enrichment details.
- Pin Option: Users can click the pin icon to keep the Entity Panel open and visible when navigating to other pages where it is available.
- Date Range: The date range displayed in the Entity Panel defaults to the time range of the page from which it was opened. See, Date ranges.
- History: Displays up to 50 of the most recent actions performed on the device, including manual isolation, automatic isolation, and removal of isolation. History is only applicable to CrowdStrike, EDR, and FortiManager integrations. Actions performed by the Fortinet Automation Service will appear in the Fortinet Automation Service tab.
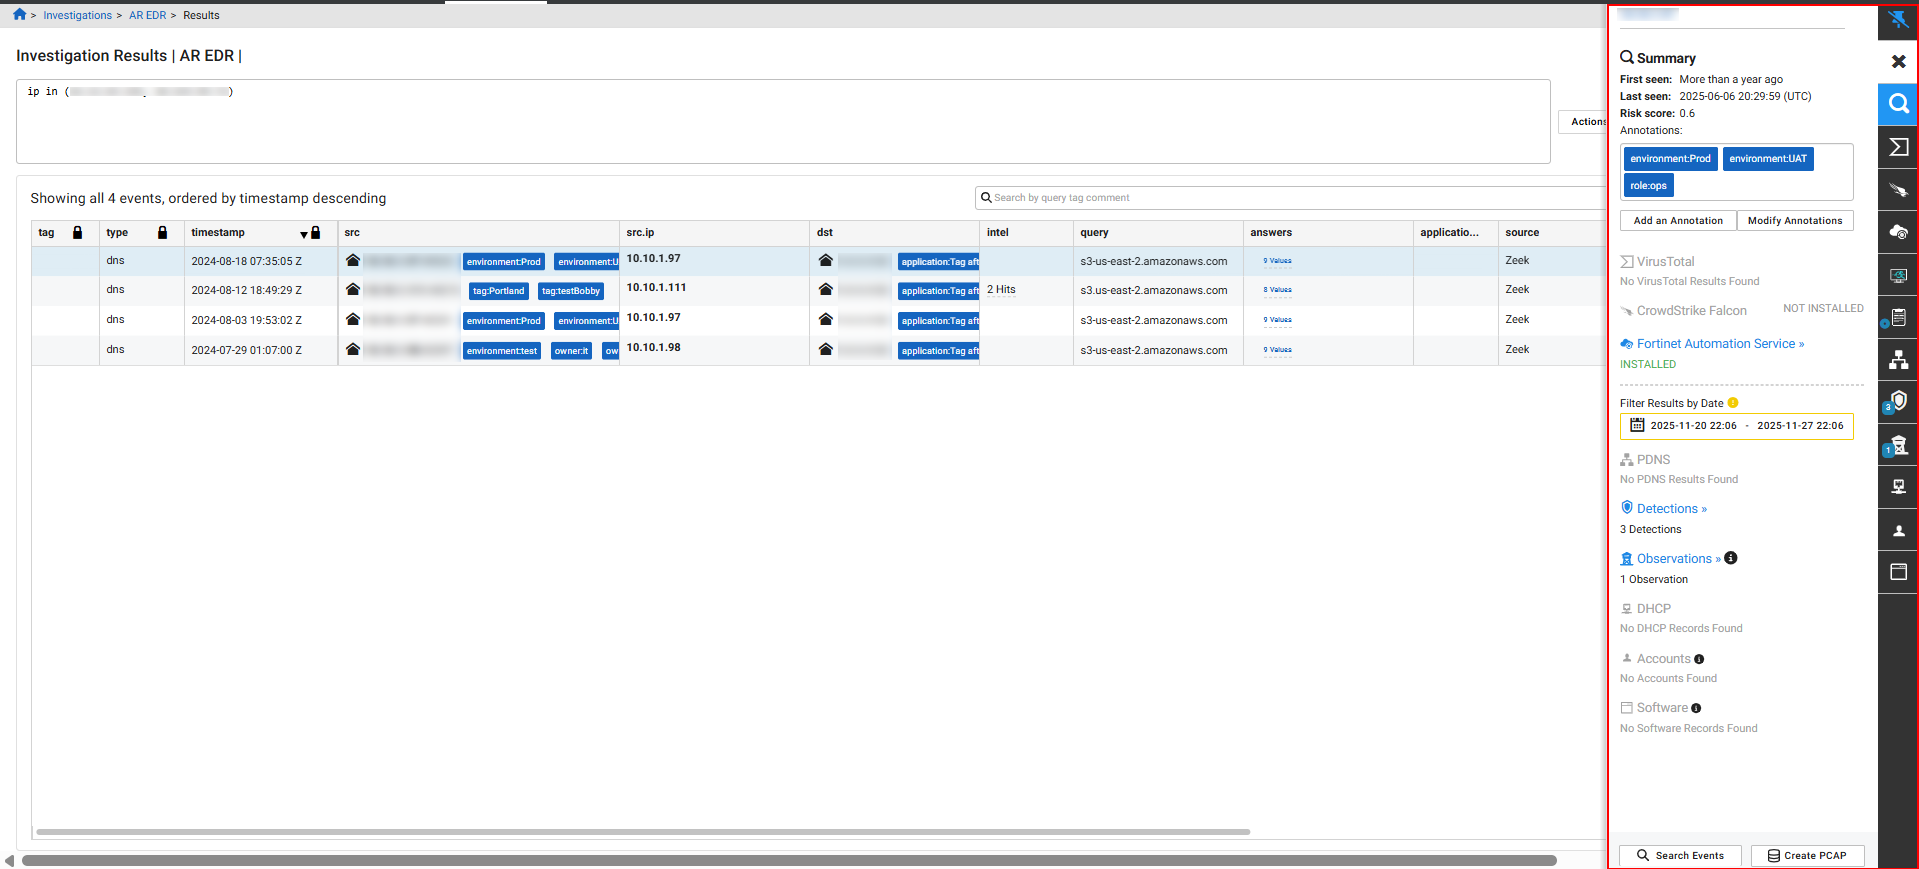
Entity information tabs
The tabs on the right side of the panel display contextual and activity information, along with external threat intelligence and enrichment details.
|
Tab |
Description |
|---|---|
|
Summary |
This tab displays timestamps for when the entity was first and last seen, applied tags, and a summary of records found in other tabs. The summary also includes a button to initiate immediate response actions, such as Contain, Isolate, or Ban an endpoint. |
|
VirusTotal |
Contains details from the FortiNDR Cloud integration with VirusTotal, including information on Detected URLs, Resolved URLs (passive DNS resolution), and hashes of files (Communicating, Downloaded, or Referrer Samples) related to the entity. |
|
Crowdstrike |
This tab appears when the Crowdstrike integration is enabled. For more information see, CrowdStrike Falcon integration for FortiNDR Cloud. |
|
Fortinet Automation Service |
This tab appears when the Fortinet Automation Service is provisioned. See, Fortinet Automation Service . |
|
FortiEDR |
This tab appears when the FortiEDR integration is enabled. For more information see, FortiEDR integration for FortiNDR Cloud. |
|
FortiManager |
This tab appears when the FortiManager integration is enabled. For more information see, FortiNDR Cloud for FortiManager. |
|
PDNS (Passive DNS) |
Displays all passive DNS records observed for the entity for the entire life of the account. |
|
Detections |
Lists all Active detections associated with the entity within the selected time range, along with their Last Seen and Created dates. This allows analysts to quickly view specific threats targeting that entity. |
|
Observations |
Displays a list of any Behavioral Observations associated with the entity. Behavioral Observations offer context for threat hunting and investigating network activities. Clicking an observation title here opens the Observation Details page. See Behavioral observations. |
|
DHCP |
Displays all DHCP records for the entity for the life of the account. |
|
Accounts |
Shows Kerberos and NTLM records observed for the entity over the past 30 days. This is useful for identifying the users of an internal asset. |
|
Software |
Lists all software associated with the entity, observed from any network protocol. |
|
FortiGuard |
Indicates if a malicious file is detected with the message File identified as malicious and provides a hyperlink to view attributes about the malicious file. |
|
WHOIS |
Provides registration information populated by FortiNDR Cloud WHOIS lookups. |
Adding annotations and viewing malicious files
To add an annotation:
- In the Summary tab click Add an Annotation. The Create an annotation dialog opens.
- From the Select an annotation type drop-down, select the annotation type.
- In the Enter an annotation name field, enter a name for the annotation.
- In the Enter a description field, enter the annotation.
- Click Save. The annotation is added to the Summary tab.
To modify annotations:
- In the Entity Panel, click Modify Annotations. The Manage Annotations for <IP_address> dialog opens.
- (Optional) In the search field, enter an annotation name.
- Select or deselect an annotation and click Update.
To view malicious files with FortiGuard:
- In the investigation results, click the link in the File column.
- Click a link in the Files dialog.
- The FortiGuard area displays the File identified as malicious flag.
Date ranges
Keep the following considerations in mind when view viewing results with the date range picker.
| Summary tab |
|
| Date out of range |
|
| Default time range |
|