Entity Panel
An Entity is a unique identifier on the network. FortiNDR Cloud supports IP addresses and domains as entities. Entities are extracted from event data and cataloged in their own data store.
The Entity Panel displays the contextual information collected for an entity from within and outside the network. To access the Entity Panel, click an IP address in the detector details tabs or click View Device Details in the Actions menu.
|
|
Click the pin icon |
 at the top-right side of the pane to keep the Entity Panel open and visible when switching between pages where it is available. See,
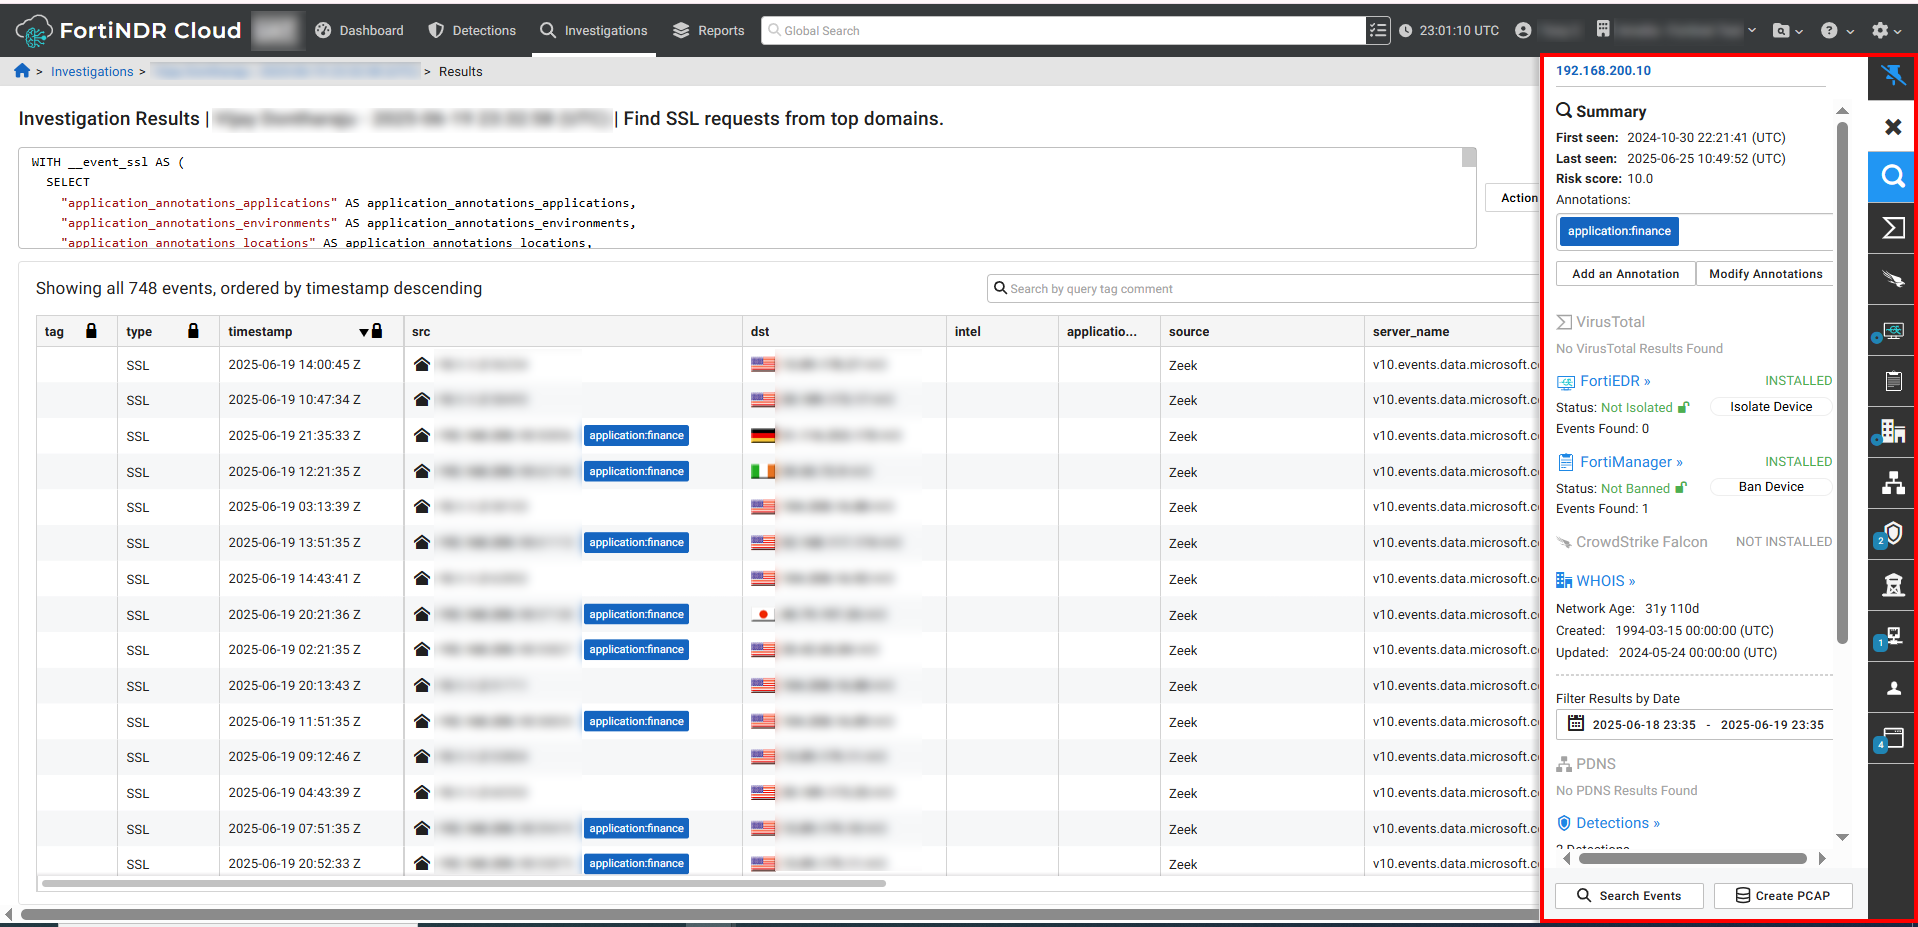
The Entity Panel is organized into tabs on the right side of the page.
| Summary |
Shows the first and last seen timestamps, applied tags, and a summary of records on subsequent tabs. The summary First seen and Last seen fields will display a timestamp for the last year. If the summary is more than a year old, More than a year ago is displayed. The summary also includes a button to Contain, Isolate, or Ban an endpoint. |
| VirusTotal |
Populated by FortiNDR Cloud integration with VirusTotals details for:
|
| WHOIS | Populated by FortiNDR Cloud WHOIS. |
|
Filter Results by Date |
You can filter the results by date for up to one year. In the Detections tab uou have the option of filtering by Date Range Type:
A yellow border appears around the date picker when you pivot to the Entity Panel from a page with a time range greater than one year. The date picker will also default to the last seven days. |
| PDNS |
All passive DNS records observed for the entity for the life of the account. Two sets of data are displayed: DNS record in the time range and Passive DNS record all time. Records are displayed in the order they were last seen. The records within the time range appear at the top of the list. Records within the time range are highlighted by First in Time Range and Last in Time Range. The Type field indicates if the DNS type such as IPv4 (a), IPv6 (aaaa), canonical name (CNAME), name server (NS), mail exchange (MX), and text TXT. |
| Detections | Displays the Active detections within the time range, and the Last Scene and Created dates for each detection. |
| Accounts | Kerberos and NTLM records observed for the entity over the past 30 days, particularly useful for identifying the users of an internal asset. |
| DHCP | All DHCP records for the entity for the life of the account. |
| Software | All software associated with the entity, observed from any network protocol. |
|
FortiGuard |
Indicates a malicious file is detected, with the message File identified as malicious.Click the section header or the FortiGuard icon to view the attributes about the malicious file. If the attributes are not available, then none are displayed. See To view malicious files with FortiGuard. |
|
FortiEDR |
This tab appears when the FortiEDR integration is enabled. For more information see, FortiEDR integration for FortiNDR Cloud. |
|
Crowdstrike |
This tab appears when the Crowdstrike integration is enabled. For more information see, CrowdStrike Falcon integration for FortiNDR Cloud. |
|
Observations |
Displays a list of any observations associated with the entity. Click an observation title in this section to open the Observation Details page. |
Adding annotations and viewing malicious files
To add an annotation:
- In the Summary tab click Add an Annotation. The Create an annotation dialog opens.
- From the Select an annotation type drop-down, select the annotation type.
- In the Enter an annotation name field, enter a name for the annotation.
- In the Enter a description field, enter the annotation.
- Click Save. The annotation is added to the Summary tab.
|
|
For information about managing annotations, see Annotations. |
To modify annotations:
- In the Entity Panel, click Modify Annotations. The Manage Annotations for <IP_address> dialog opens.
- (Optional) In the search field, enter an annotation name.
- Select or deselect an annotation and click Update.
To view malicious files with FortiGuard:
- In the investigation results, click the link in the File column.
- Click a link in the Files dialog.
- The FortiGuard area displays the File identified as malicious flag.
Date ranges
Keep the following considerations in mind when view viewing results with the date range picker.
| Summary tab |
|
| Date out of range |
|
| Default time range |
|
Accessing the Entity Panel
You can access the Entity Panel from the following pages:
- Investigation Results: Click an IP address in the Results table.
- Observation : In the Dashboard > Observation details
- Manage Annotations: Click the Entity Name in the Manage Annotations page when the entity is a valid IP, CIDR, domain, or URL.
- Adhoc Search Results
- Visualizer
- Detection Table
- Detection Triage
- Entity Lookup
- Detection Event Indicator
- Visible Device Page (Sensor)