
Reports
The following reports are available: FortiNDR Cloud Network Security Posture Report, FortiNDR Cloud Network Traffic Usage Report, FortiNDR Cloud Network Traffic Usage of a Sensor Report and FortiNDR Cloud Detections Report.
Generating reports
To generate a report:
- From the top navigation, select Reports. The Reports page opens.
- Select the date range and click Apply.
- Click Run Report.The browser will transition from the template list to the report page while retrieving data to complete the report. Each section will update individually as data is retrieved. Sections will appear as data is ready.
- Click Print. The Print dialog opens.
- Click Save. Select a location to save your report and click Save again.
FortiNDR Cloud Network Traffic Usage of a Sensor Report
This report provides daily insights into network traffic patterns for an individual sensor by identifying top source and destination IPs, high-volume IP pairs (Top Talkers), busiest destination ports, and ports with unidentified protocols.
FortiNDR Cloud Network Traffic Usage Report
The Network Traffic Usage report provides a comprehensive view of traffic distribution across multiple dimensions. It includes visualizations such as bar charts, pie charts, and detailed data tables to help analyze network activity. A Sankey chart is available for aggregations where Group By includes two IP fields or when there are two dimensions and a measure. The Sankey chart type appears only when there are 50 or fewer dimensions.
Traffic usage can be grouped by source and destination IP addresses, applications, protocols, and other relevant categories. Each chart displays comparative usage trends, while the accompanying data tables show exact values and percentages for each category. This report enables analysts to quickly identify high-traffic sources, dominant applications, and overall usage patterns for effective monitoring and optimization.
FortiNDR Cloud Detections Report
The FortiNDR Cloud Detections Report is useful for analysis and threat hunting. It provides key security performance metrics, focusing exclusively on resolved detections. This approach ensures that analysts can accurately measure the effectiveness of their detection and response processes.
This report provides an overview of the number detections within a specific time range and can be useful for threat hunting. The report includes only resolved detections when calculating metrics. Any active detections within the selected time range are excluded from these calculations.
When calculating results, FortiNDR Cloud applies the following filters:
- Created Date within the selected time range
- Muted and Disabled state set to All
- Detection Status set to Resolved
The report criteria includes detections observed, attack category and severity. For each detection there is an overview and the number of events that satisfy the detector. The Executive Summary displays:
| Total Detections | Number of detections within the specified time range. |
| Devices with detections | Number of devices with detections within the specified time range. |
| Mean Time to Detect (MTTD) |
Average time in seconds between when an incident was first seen and when it was created in the system. Mean Time to Detect is calculated by averaging the time difference (in seconds) between the FirstSeen and Created timestamps for all detections with a status of Resolved. |
| Mean Time to Resolve (MTTR) |
Average time in seconds between when an incident was created and when it was resolved. Mean Time to Resolve is calculated by averaging the time (in seconds) between the Created timestamp and the ResolutionTimestamp for all detections marked as Resolved. |
| Mean Dwell Time (Dwell) |
Average time in seconds between when an incident was first seen and when it was resolved. Dwell Time is calculated by averaging the time (in seconds) between the FirstSeen and ResolutionTimestamp for all detections with a status of Resolved. |
| Devices with Detections | Total of unique device IP from all detections |
FortiNDR Cloud Network Security Posture Report
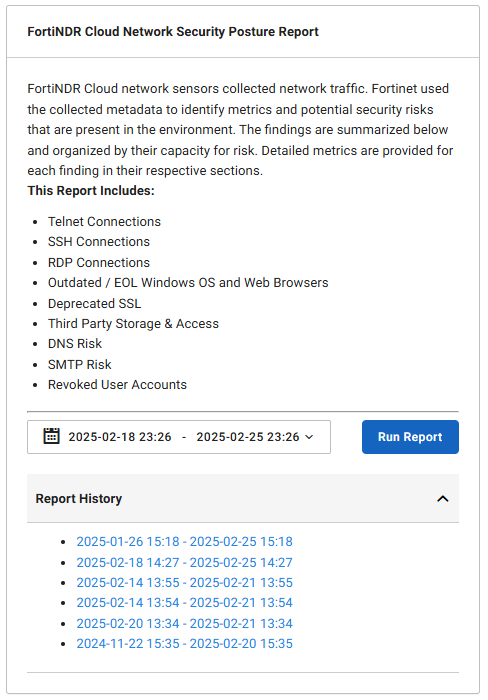
This report analyzes 10 aspects related to your overall security posture. This report allows you to view an investigation and the results for an event. The report also provides a list a of generated reports in the Report History. Please a allow a few minutes for the report to generate. To run the report, select one or more sensors from the dropdown menu, set the time range, and then click Run Report.
|
|
You can navigate away from the Posture Report page after clicking Run Report. However, the report will remain incomplete indefinitely if you close your browser tab or log out of the portal. When this occurs, the following error message is displayed: The report is incomplete. Please run it again. |
Report history
The Report History panel in the FortiNDR Cloud Network Security Posture Report tile, displays a log or previous reports by time range. You can click a range in the list to regenerate the report.
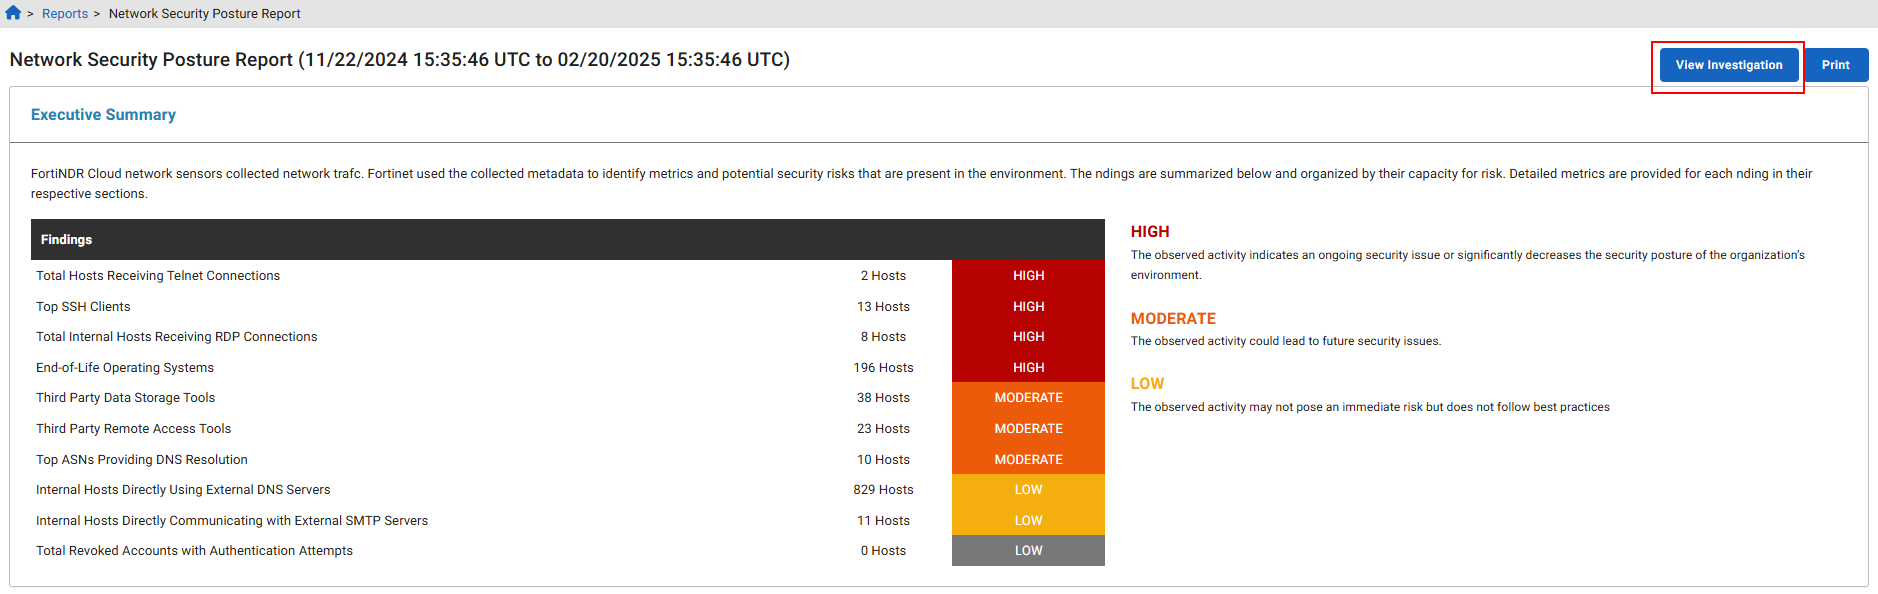
View investigations
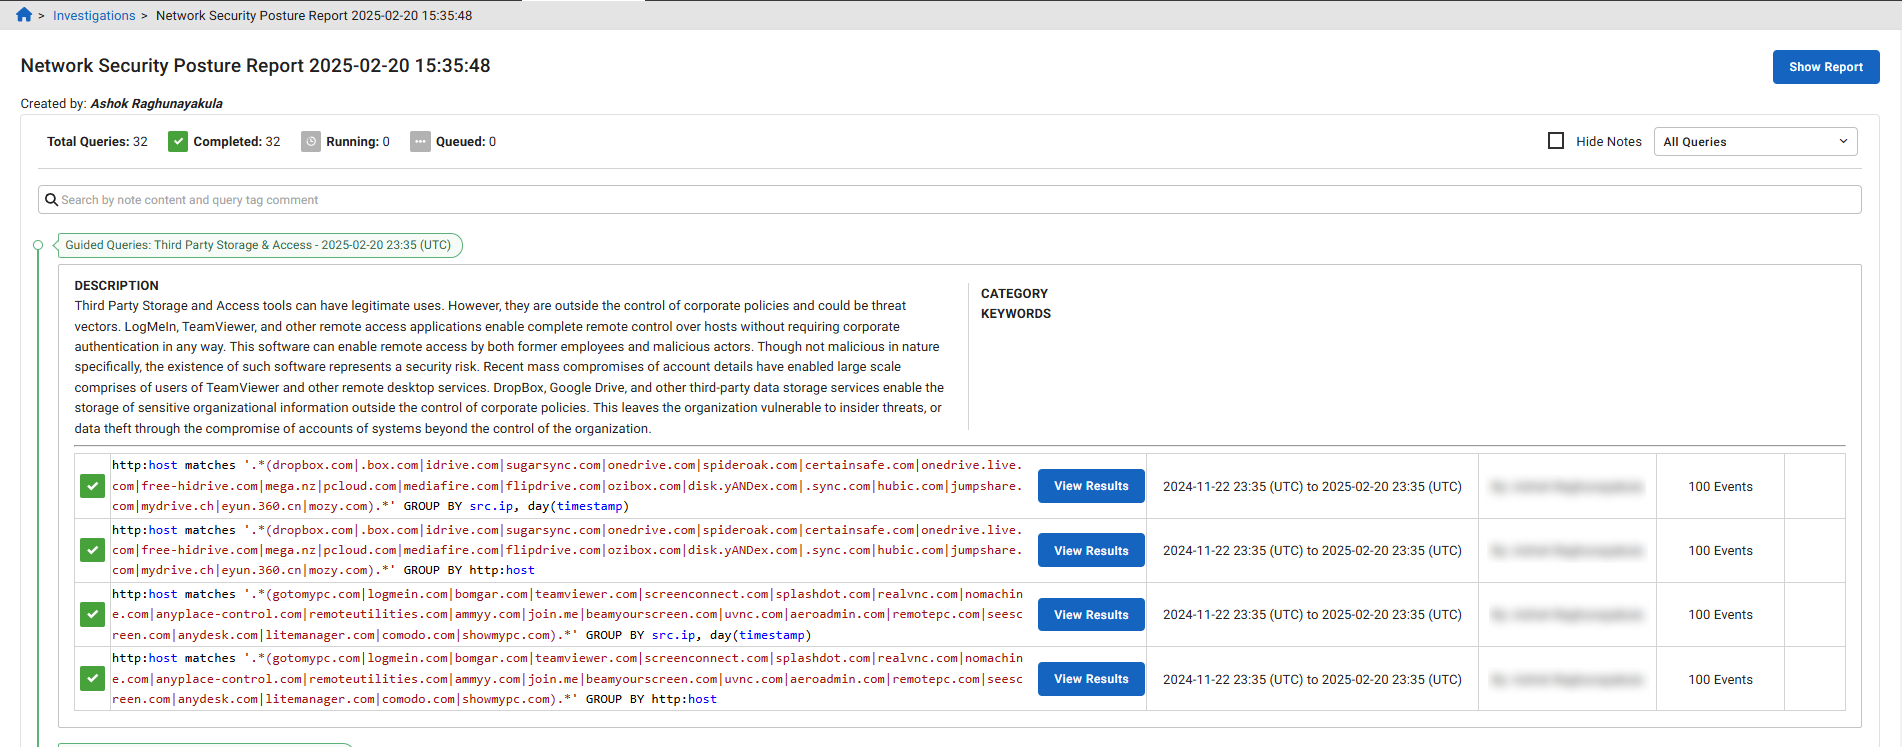
After the report is generated, click the View Investigations button in the report to view the investigation in Read-Only mode.
In the report, click View Results to view individual results for an event, or click Show Report to return to the report.
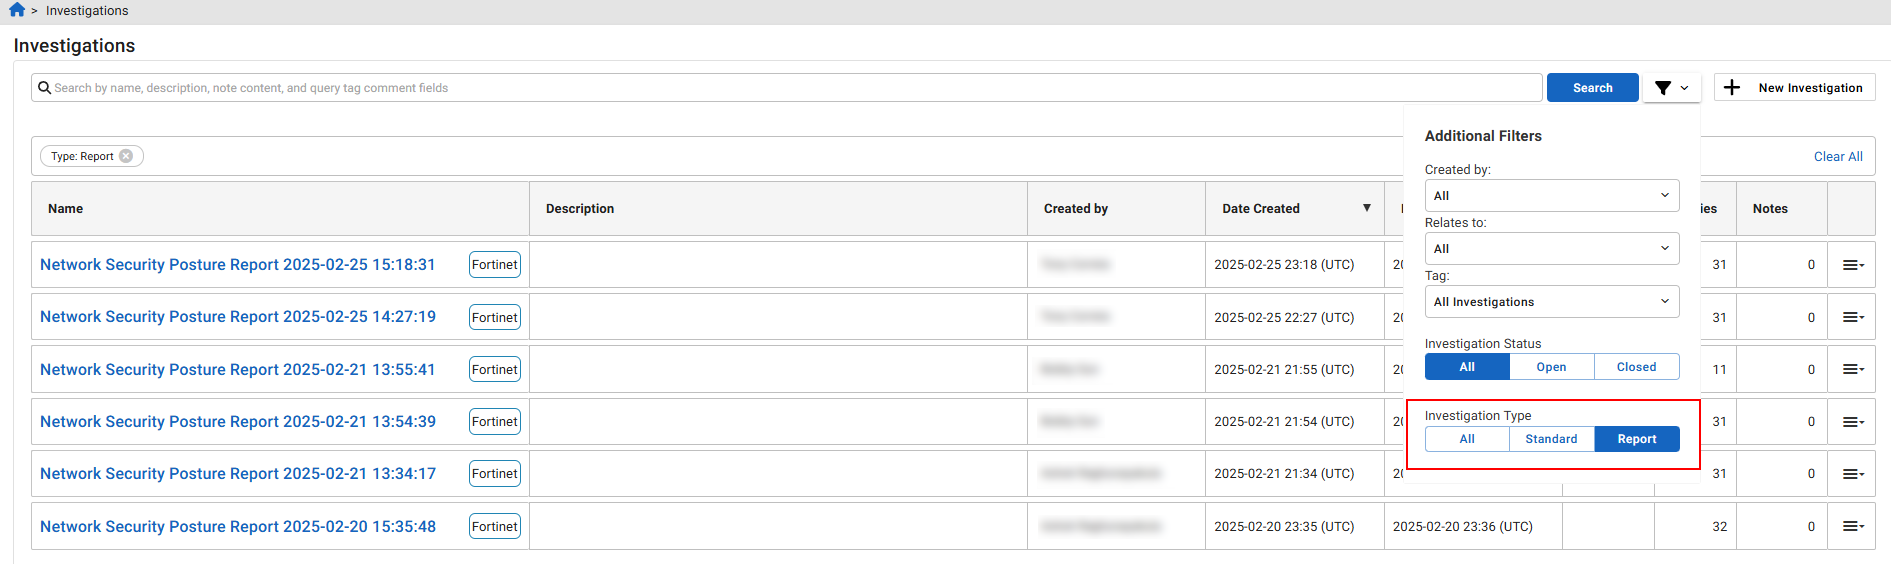
In the Investigations page, you can use the Report filter to search for FortiNDR Cloud Network Security Posture Report investigations.
Pending queries in reports
FortiNDR Cloud can support up to 35 pending queries simultaneously. To prevent system overload, a tooltip will appear across all of your accounts advising users to wait before running another report.