
Behavioral observations
A Behavioral Observation is an output from an expert system or machine learning-based model that considers one or more event types and historical events. These observations are produced by analyzing threat actors' behaviors, profiling various aspects to identify unknown malicious activity. Not every observation is malicious on its own, but those deemed detection-worthy will have detections created by the Fortinet team, typically for high and some moderate-level observations.
FortiNDR Cloud's power comes from combining detections and observations, which can be viewed in various sections like the Entity Panel and Observations page.
How Behavioral Observations are different from Detections:
|
Behavioral Observations |
Detections |
|---|---|
|
|
Behavioral Observations page
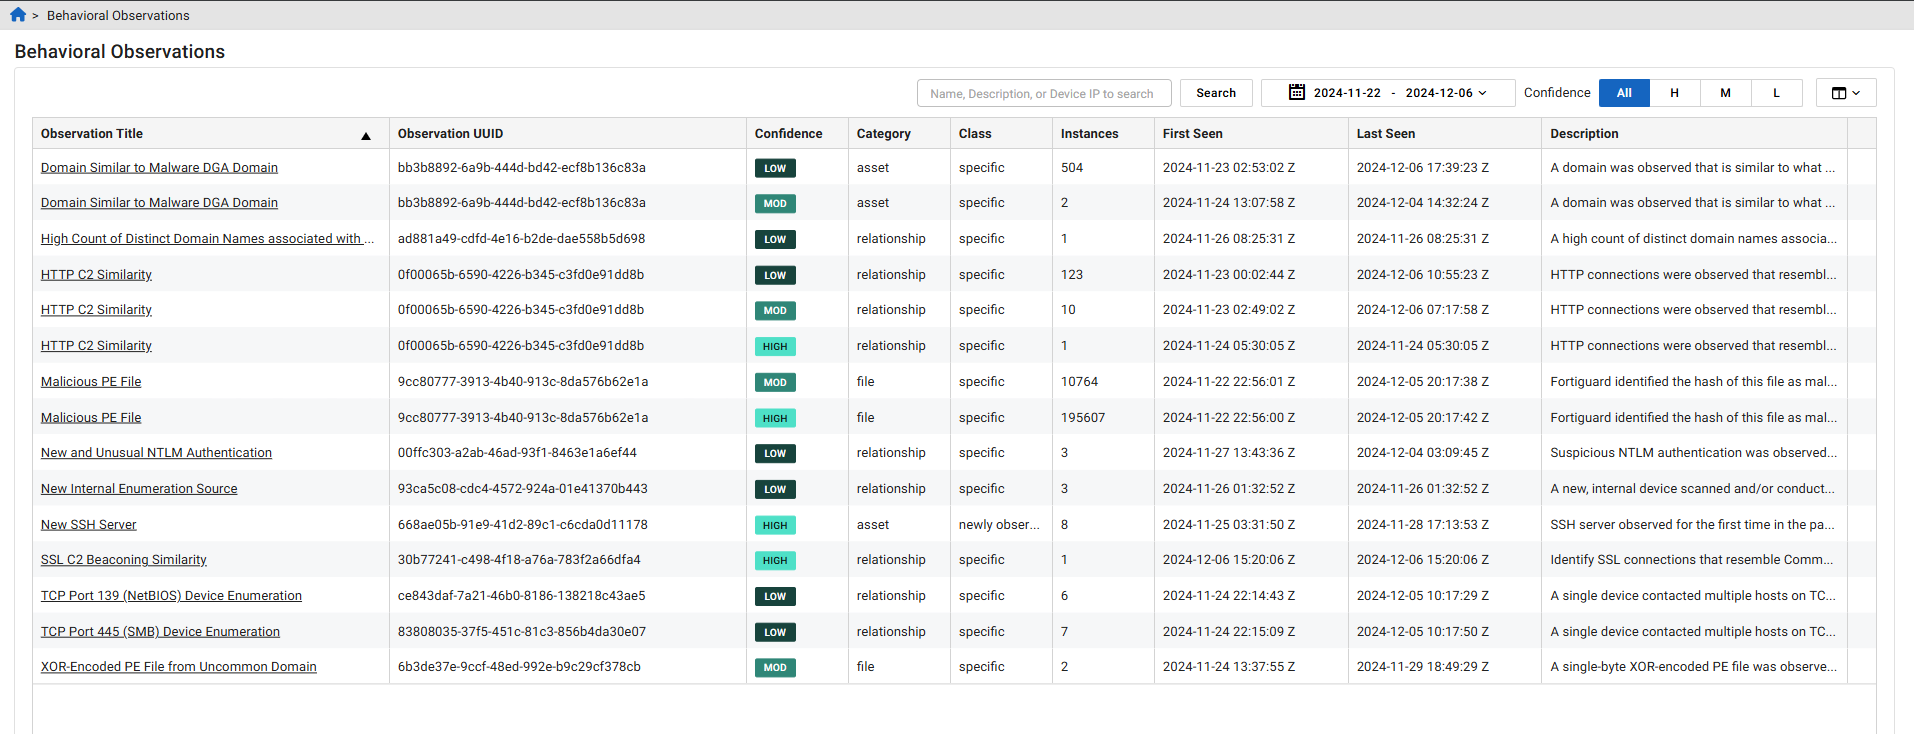
The Behavioral Observations page shows observations for a selected time range and filters. By default, the page shows observations for the previous two weeks and all confidence levels. This is also the landing page for the Behavioral Observations widget in the default Dashboard.
You can use the search field to find observations that contain instances of a specific IP address, Observation UUID or text in the Observation Title and Description columns. Use the date picker to create a custom time frame. Behavioral Observations can be retrieved for up to the last 90 days.
Working with Behavioral Observations
Behavioral Observations can be used in threat hunting and as additional evidence for analyzing network activities. They can be viewed at the device level within the Entity Panel. You can use Behavioral Observations to create custom detectors and as evidence in IQL to initiate investigations.
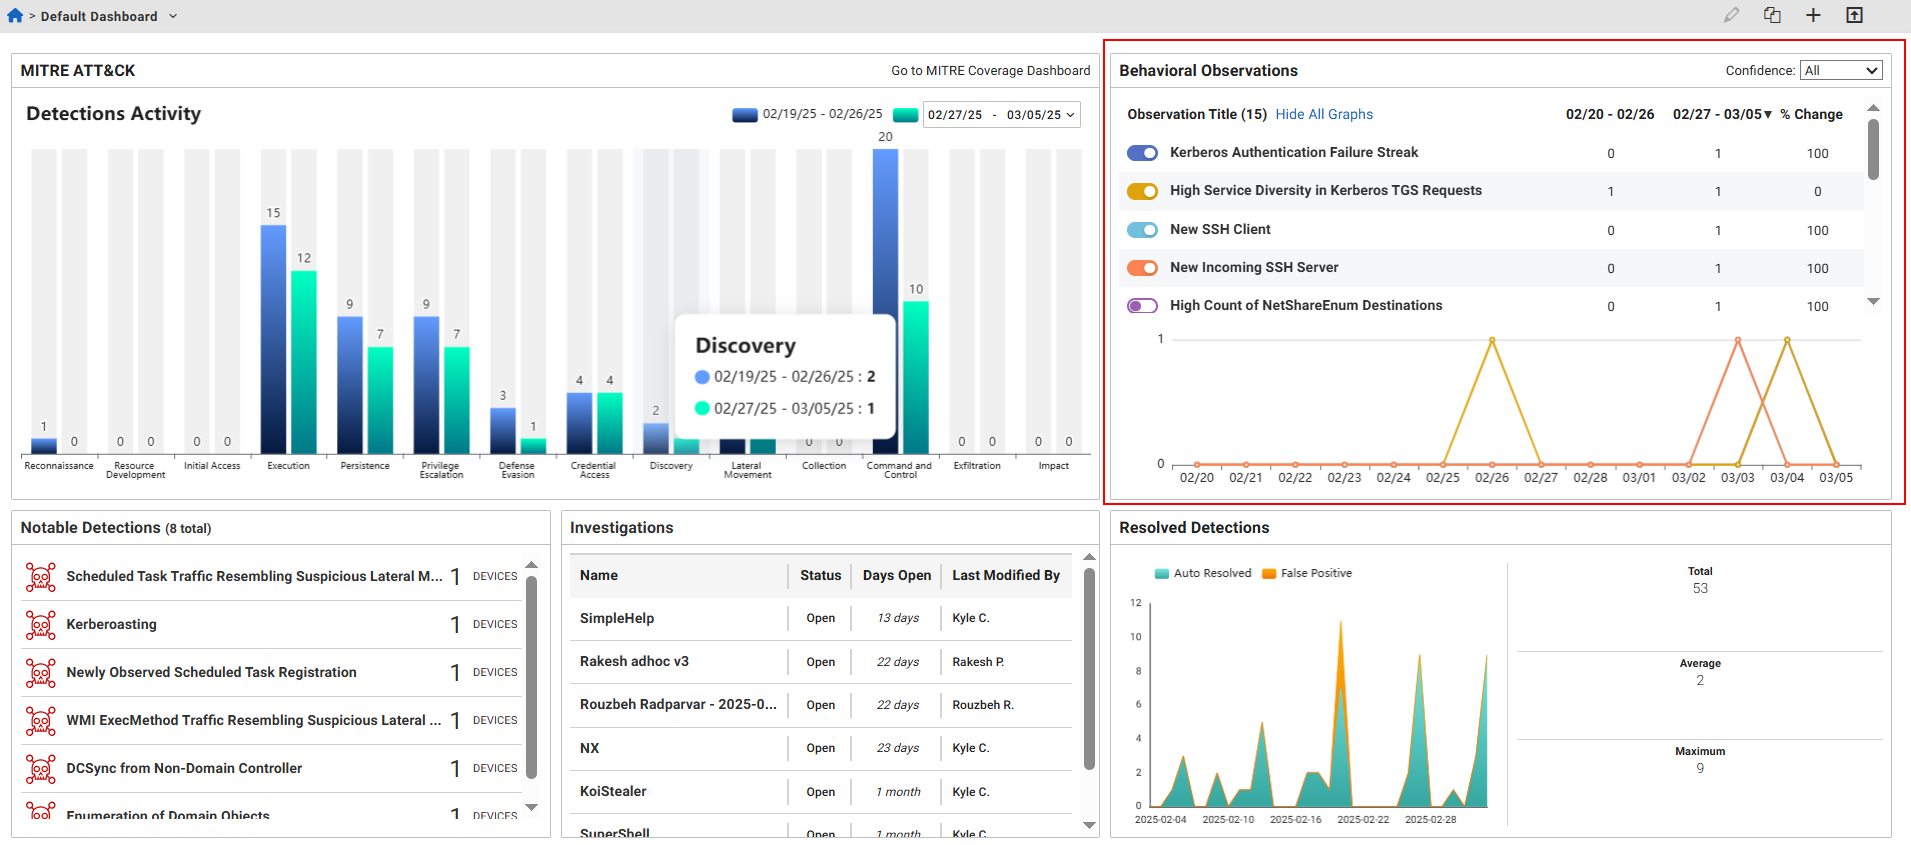
Behavioral Observations Widget
When you log into the FortiNDR Cloud Portal, the Default Dashboard displays the Behavioral Observations widget. This widget shows a list of the Behavioral Observations for the previous two weeks. Click an Observation Title to pivot to the Behavioral Observation Details page.
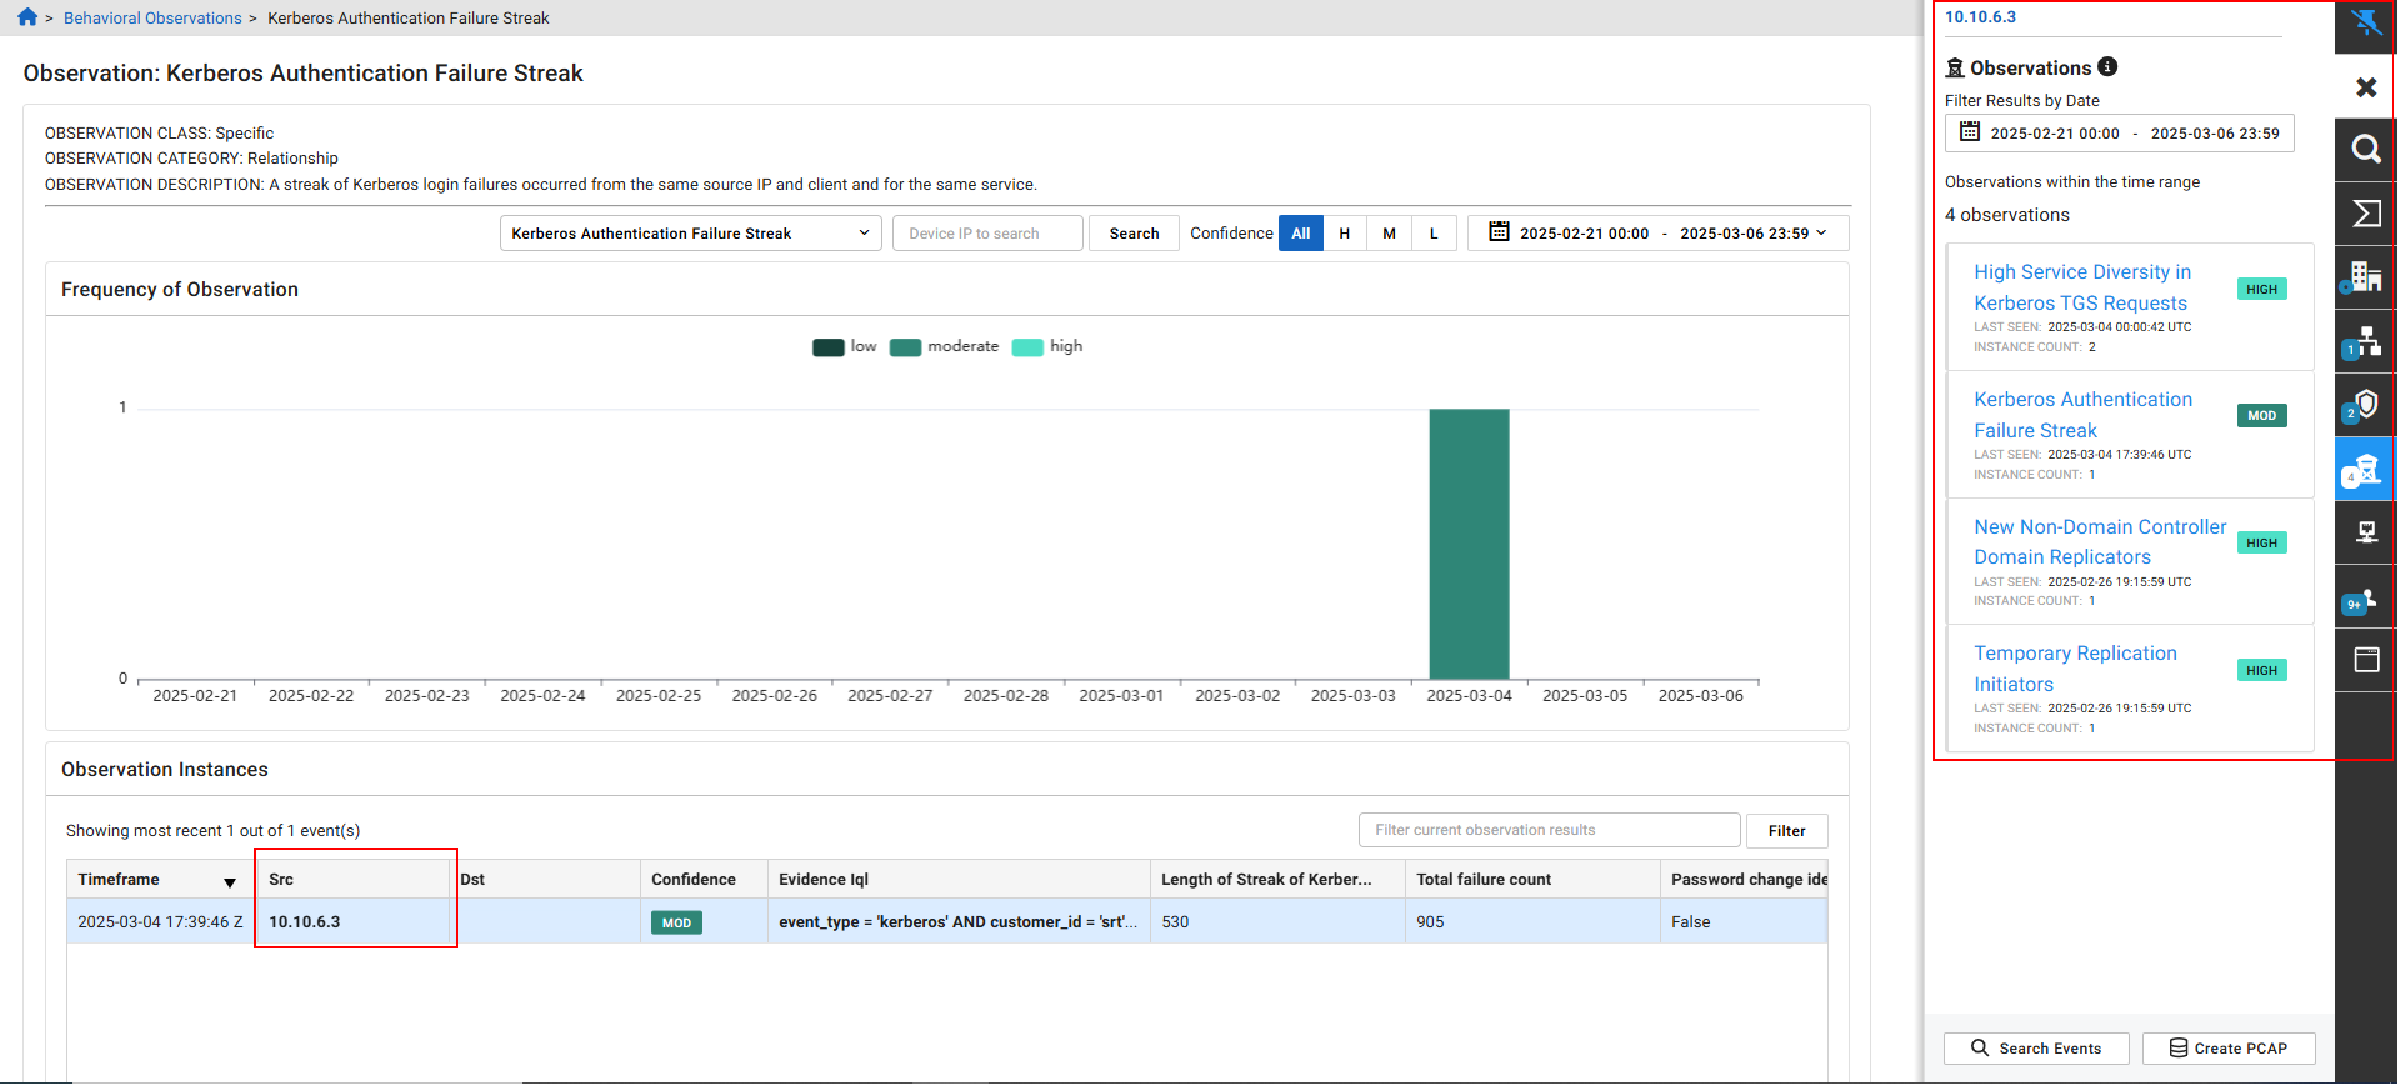
Behavioral Observation Details
The observation class, category and description appear at the top-left of the page. You can view Behavioral Observations for an individual entity in the Entity Panel by clicking the IP in the Src column.
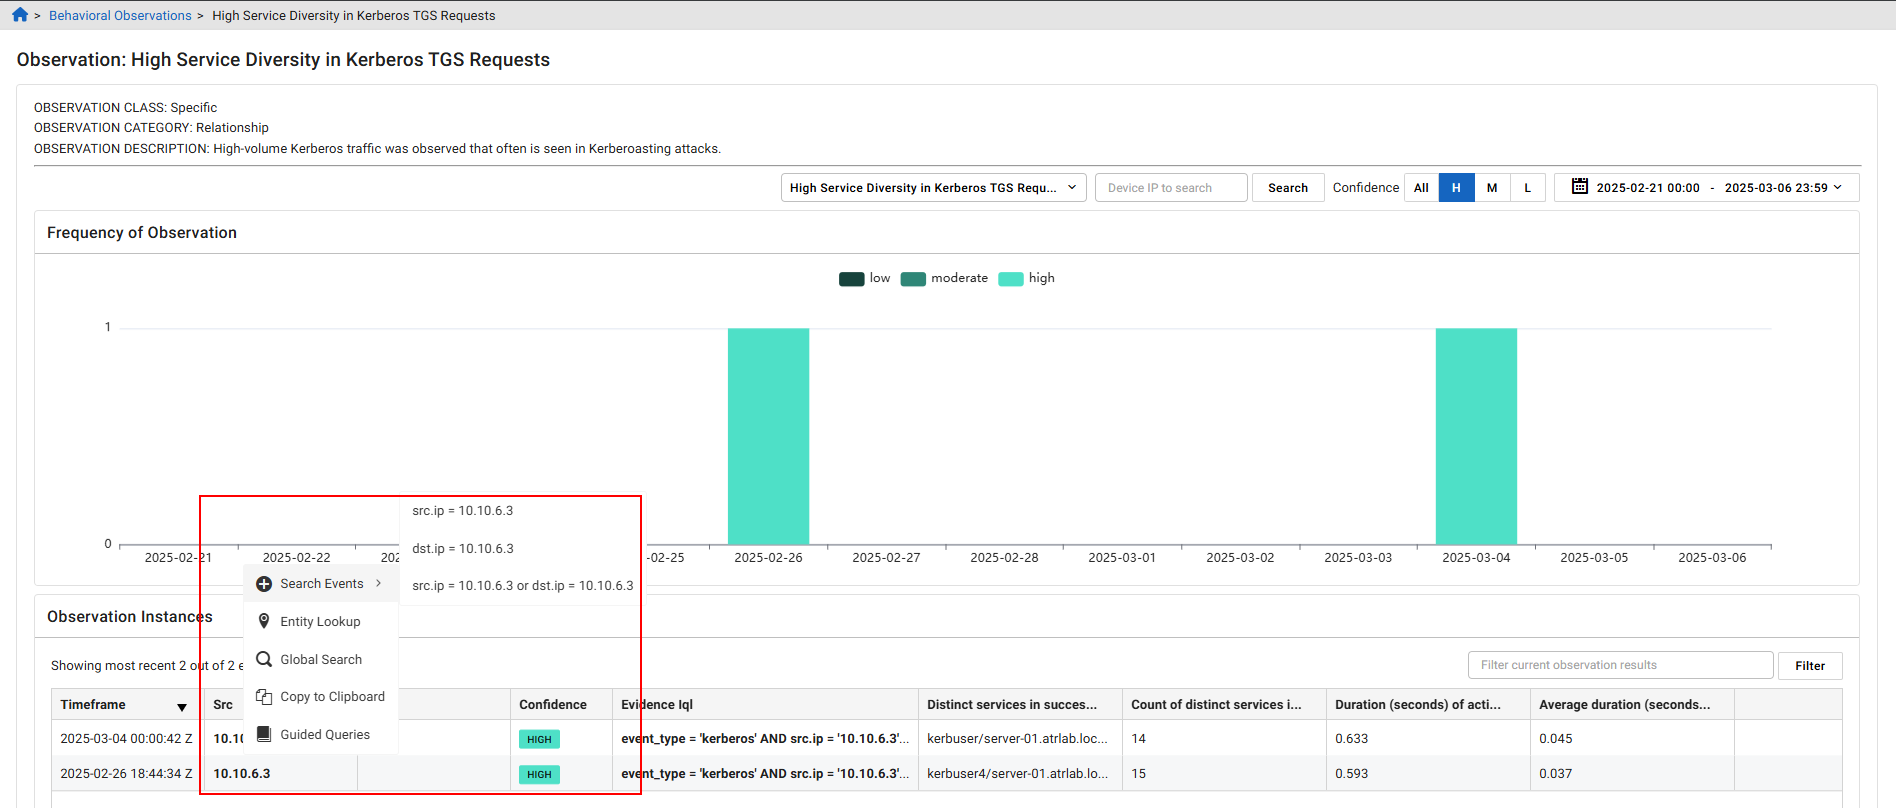
Right-click the Source IP to Search Events by field, or launch an Entity Lookup, Global Search or Guided Query. Click the CSV button in the Observation Instances section, to download the data in the page as CSV file.
You can use queries based on the observation details to create a new detector. For more information, see Creating a detector.
Behavioral Observation fields
|
Property |
Description |
|---|---|
|
category |
Category of the observation: |
|
class |
Class of the activity: anomalous, newly observed, specific |
|
dst_ip |
The destination IP of the impacted device. There may be observations with no destination device. |
|
src_ip |
The source IP of the impacted device. There may be observations with no source device. |