DPI dashboards
DPI dashboards are available from the Dashboard menu but will only display data when Fortinet DPI is enabled in the Sensor Settings page (see, Sensor settings). The dashboards display DPI events from either the past 24 hours or the past 7 days, depending on the dashboard. The data can be refreshed at any time. You can view the dashboards as a chart, pie chart, or table, and export the data as a CSV file. DPI dashboards are useful when starting an investigation. For example, if an IP address is flagged in one of the dashboards, you can enter it in the Global Search field or use it to create a query in Private Search.
The following dashboards are available:
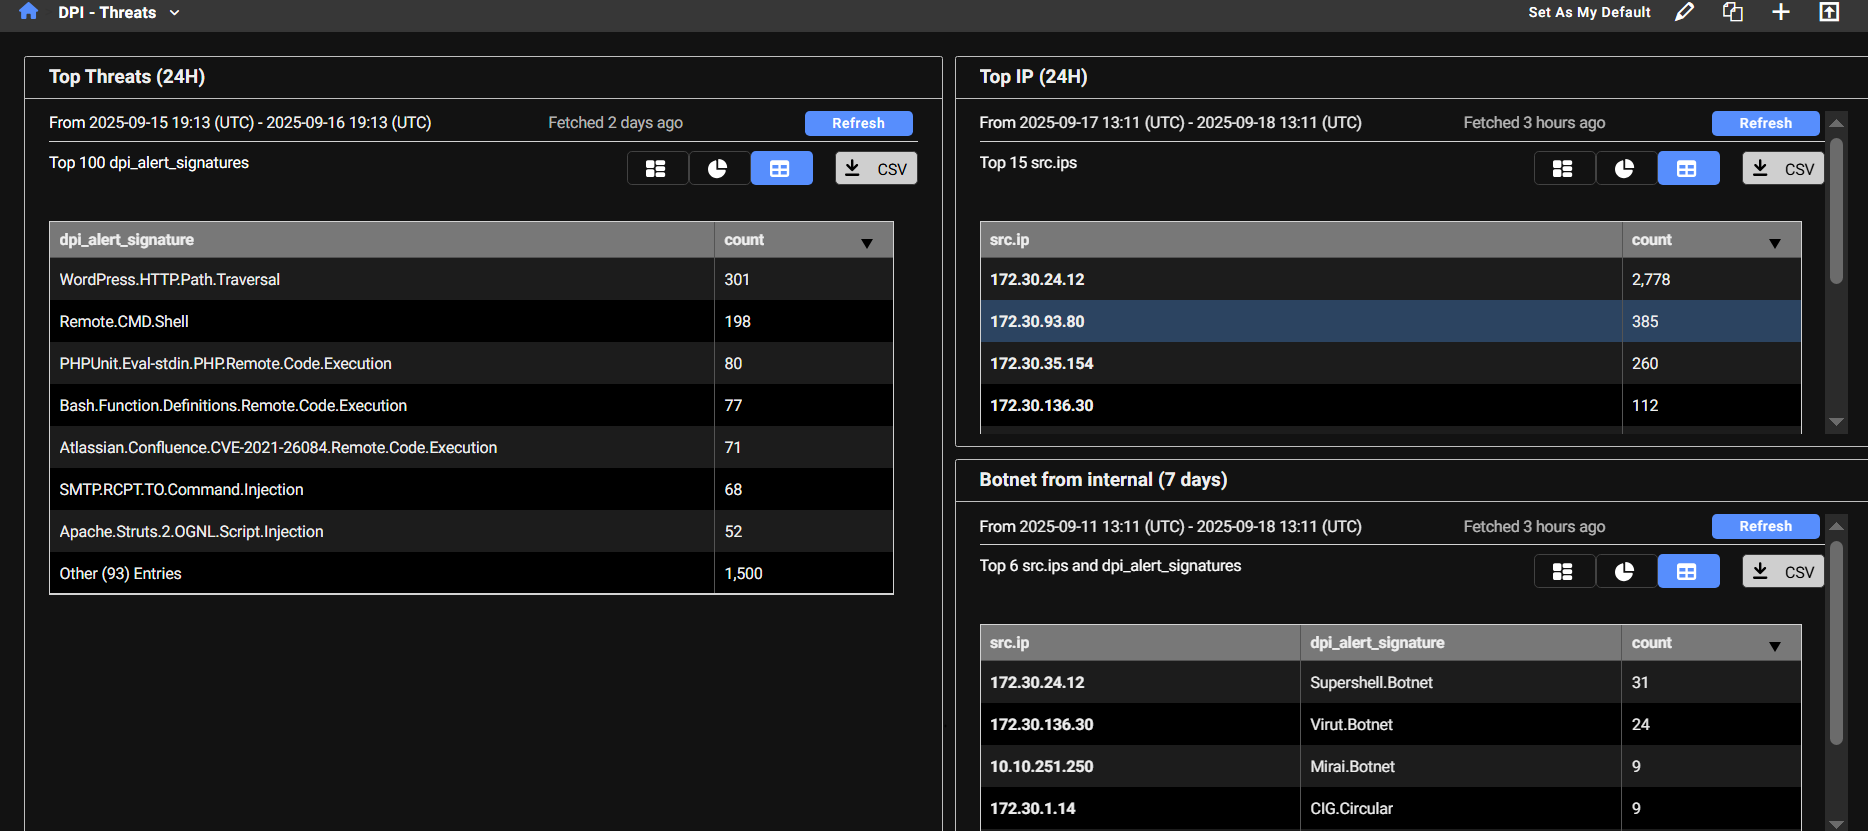
DPI - Threats
The DPI - Threats dashboard displays detected threats and their corresponding counts. The dashboard provides a summary of the most frequently detected threats and highlights the IP addresses that are triggering the highest number of signatures. When an IP address triggers a large number of IPS signatures, it’s a strong indicator that the IP should be investigated further.
This dashboard contains three monitors:
|
Widget |
Description |
|---|---|
| Top Threats |
This monitor queries high-severity IDS alerts (severity level 4) detected by DPI, where either the source or destination is internal. It excludes alerts triggered by device tagged as Scan and Nessus and filters out two noisy Apache-related signatures. The results are grouped by alert signature, helping identify which threat signatures are most frequently triggered. |
| Top IP | This monitor retrieves high-severity IDS alerts (severity level 4) detected by DPI, where either the source or destination is internal. It excludes alerts triggered by devices tagged as Scan or Nessus, and filters out two noisy Apache-related signatures. The results are grouped by source IP, helping identify which internal hosts are generating the most IDS alerts. |
| Botnet from internal | This monitor identifies outbound botnet-related DPI alerts where the source IP is internal. It groups the results by both the internal source IP and the specific botnet signature that was triggered, helping pinpoint which internal hosts are attempting to communicate with known botnets. |
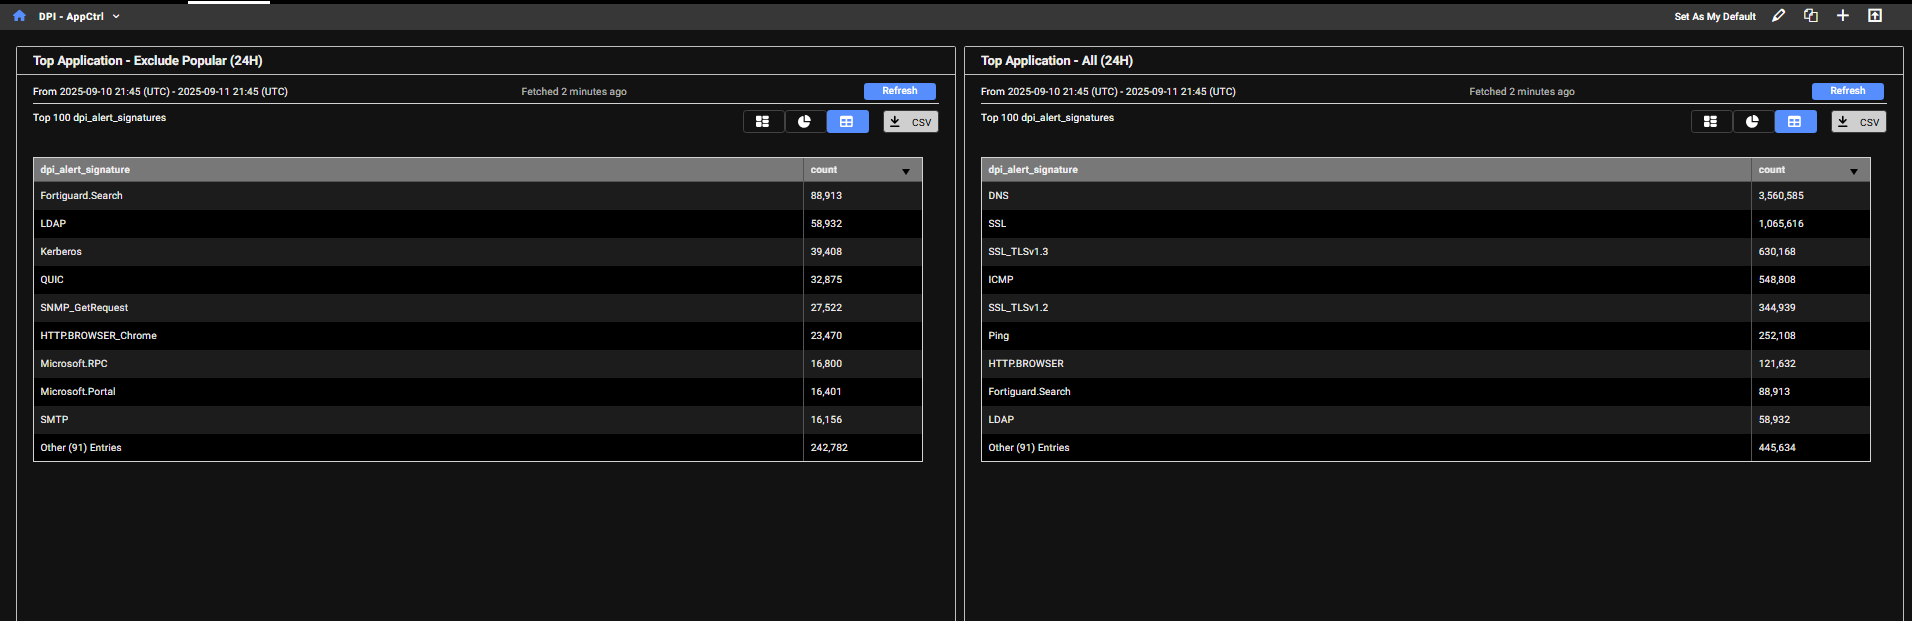
DPI - AppCtrl
The DPI - AppCtrl dashboard displays detections of applications and protocols used by IP addresses, such as DNS, HTTP, and other common services. This provides insight into the types and volume of traffic an IP address is generating.
|
Widget |
Description |
|---|---|
| Top Application - Exclude Popular (24H) |
This monitor filters out common or expected traffic (such as DNS, ICMP, ping, and browser activity) to highlight less typical application usage. The results are grouped by application signature, helping identify less common or potentially suspicious applications being used internally |
| Top Application - All (24H) |
This monitor includes all detected application types, including browser activity, offering a complete view of application traffic. The results are grouped by application signature, allowing you to see which applications are being detected across internal traffic, without the noise from automated scanners. This helps focus on legitimate or potentially suspicious application usage within the network. |
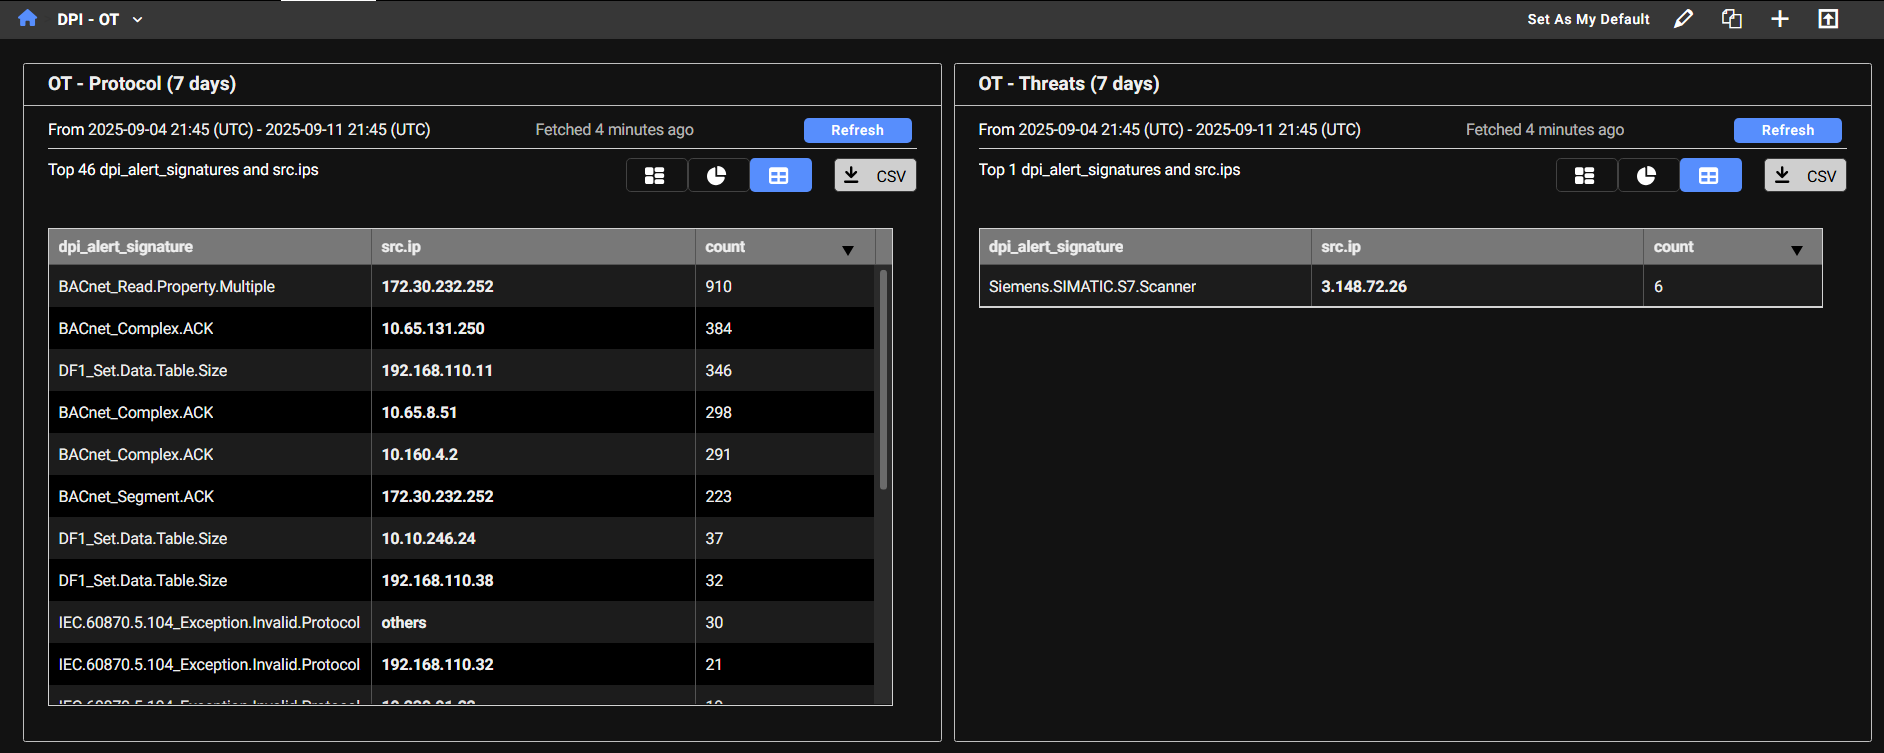
DPI - OT
The DPI - OT dashboard provides visibility into OT (Operational Technology) protocols used in industrial control systems. Any OT-related activity detected on the network will be tracked and displayed here. The dashboard highlights specific OT protocols (such as Bacnet, Profinet, and DNP3) with MP3 being one of the more commonly observed.
|
Widget |
Description |
|---|---|
| OT Protocol |
This monitor displays DPI alerts categorized as OT - Protocol, which relate to industrial control system protocols, where either the source or destination IP is internal. It excludes alerts triggered by device tagged as Scan and Nessus. The results are grouped by both the OT protocol signature and the source IP, allowing you to:
This helps in monitoring legitimate OT activity and detecting unusual or unauthorized use of industrial protocols. |
| OT Threats |
This monitor displays DPI alerts categorized as OT - Threats, which indicate suspicious or malicious activity targeting Operational Technology (OT) systems. It filters for alerts where either the source or destination IP is internal and excludes alerts triggered by device tagged as Scan and Nessus. The results are grouped by both the OT threat signature and the source IP, allowing you to:
This helps in monitoring and investigating potential compromises or unauthorized access attempts within industrial environments. |
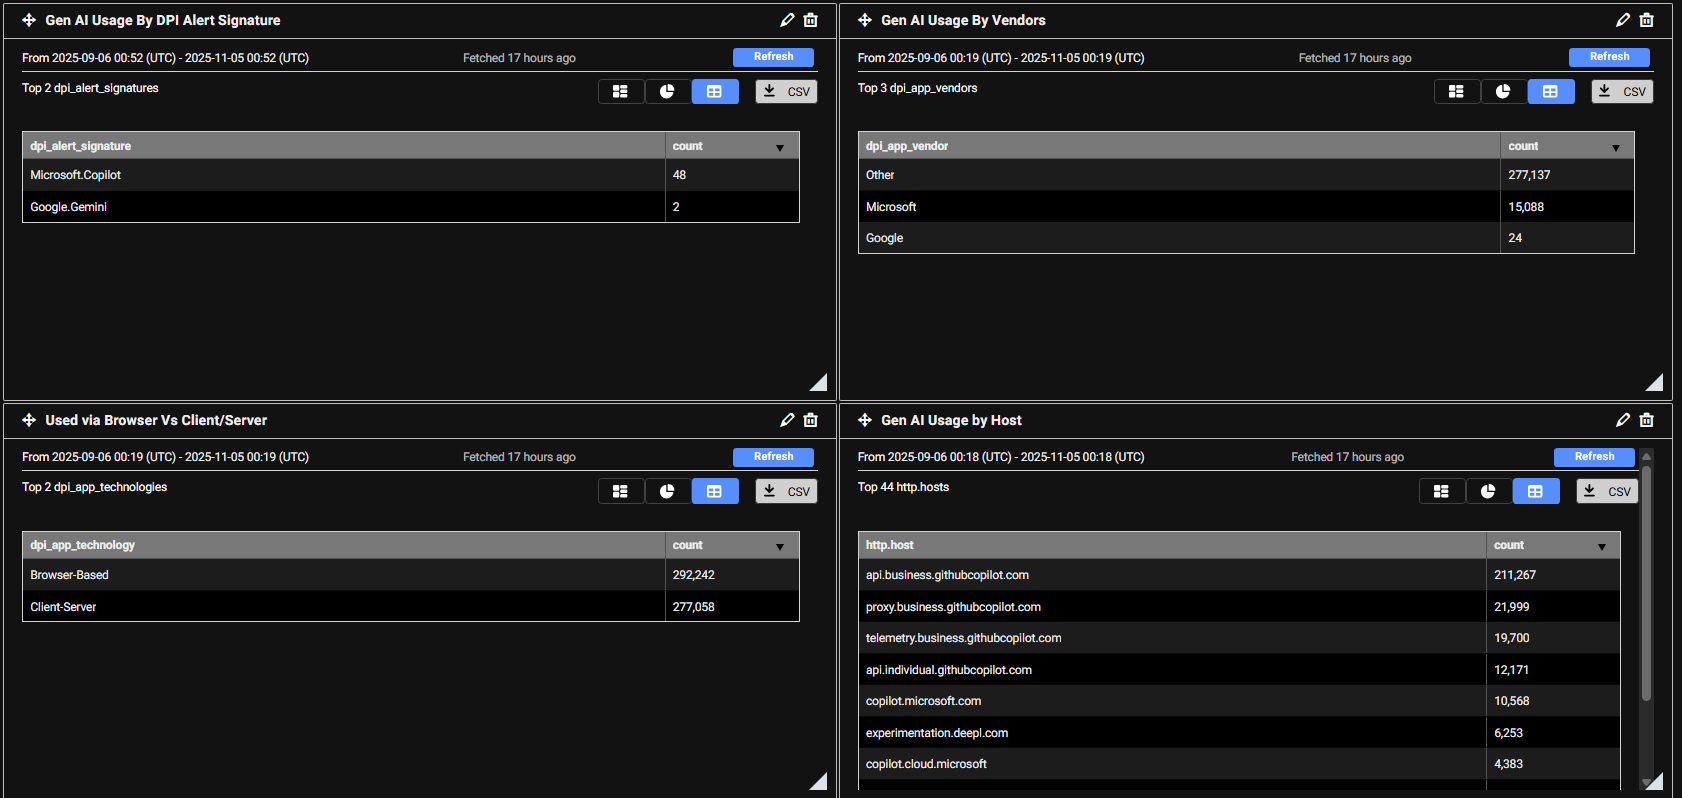
DPI - Gen AI
The Gen AI Dashboard provides visibility into organizational usage of Generative AI applications by tracking DPI (Deep Packet Inspection) events.
|
Widget |
Description |
|---|---|
|
Gen AI Usage by DPI Alert Signature |
Displays counts of DPI events triggered by specific Gen AI alert signatures (e.g., Microsoft Copilot, Google Gemini). |
|
Gen AI Usage by Vendors |
Shows the distribution of DPI event counts across different vendors, helping identify which providers are most used. |
|
Browser vs Client/Server Usage |
Compares DPI event counts for Gen AI accessed via browser-based technologies versus client-server connections. |
|
Gen AI Usage by Host (External) |
Lists external hosts associated with Gen AI traffic, ranked by DPI event counts, providing insight into endpoints most frequently accessed. |