UX score
A User Experience (UX) score is a performance metric designed to assess the quality of a user’s digital experience. It takes into account multiple factors such as endpoint health, application responsiveness, and network connectivity. The UX score is measured on a scale from 0 to 100 where lower numbers indicate a poor experience and higher numbers represent a good experience.
By tracking UX scores, you can monitor and compare both network and application performance across different time frames.
A low UX score usually points to underlying problems within the network or a user’s local environment.
Factors that impact the UX score
The UX score is determined by a combination of network and application metrics. These metrics provide insights into both the user’s connection quality and the performance of their local environment.
Network Metrics
Network metrics are measured from a remote location (OnSight or public probe) and affect the score of a specific (location, target) pair. They reflect the responsiveness of the connection between the user and the destination. Metrics include:
-
HTTP Response Time
-
DNS Lookup Time
-
Latency
-
Jitter
-
Packet Loss
Application Metrics
Application metrics are collected locally by the DEM agent and impact the scores of all (location, target) pairs where the location corresponds to the DEM server. These metrics measure the performance and health of the user’s device and local environment. Metrics include:
-
CPU Usage
-
Memory Usage
-
Wi-Fi Signal Strength
-
Download Speed
-
Upload Speed
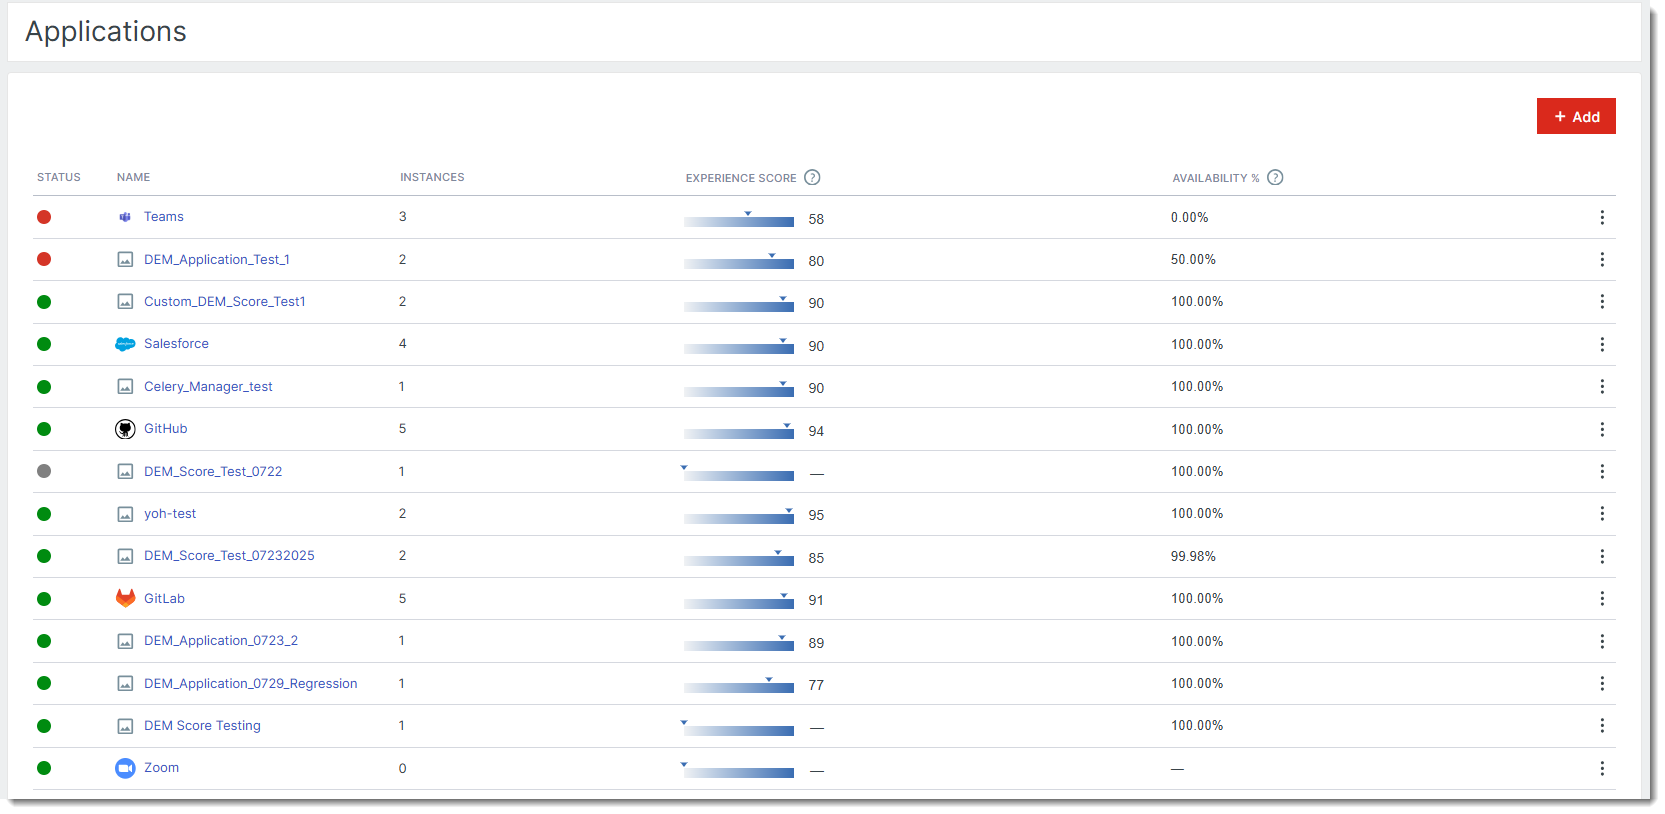
UX score in the Control Panel
You can view the UX score from the Applications page in the Control Panel. To access it, navigate to Monitoring > Applications. This page displays a list of all your monitored applications along with the UX score for each one.
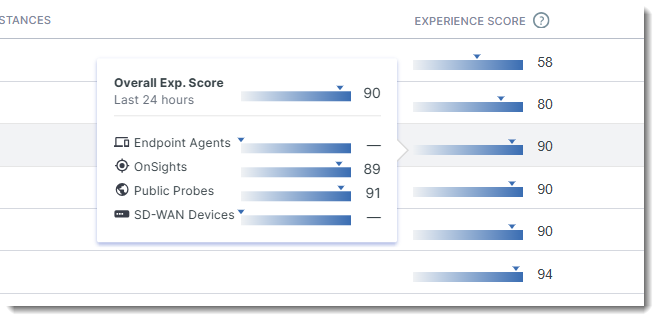
To view more information, hover your mouse over any UX score. A tooltip will appear displaying additional details, including:
-
The overall UX Score
-
The UX Scores from different monitoring locations configured for the application, such as endpoint agents, public probes, SD-WAN devices, and OnSights.
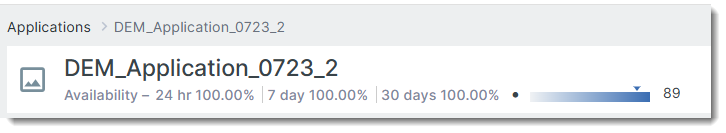
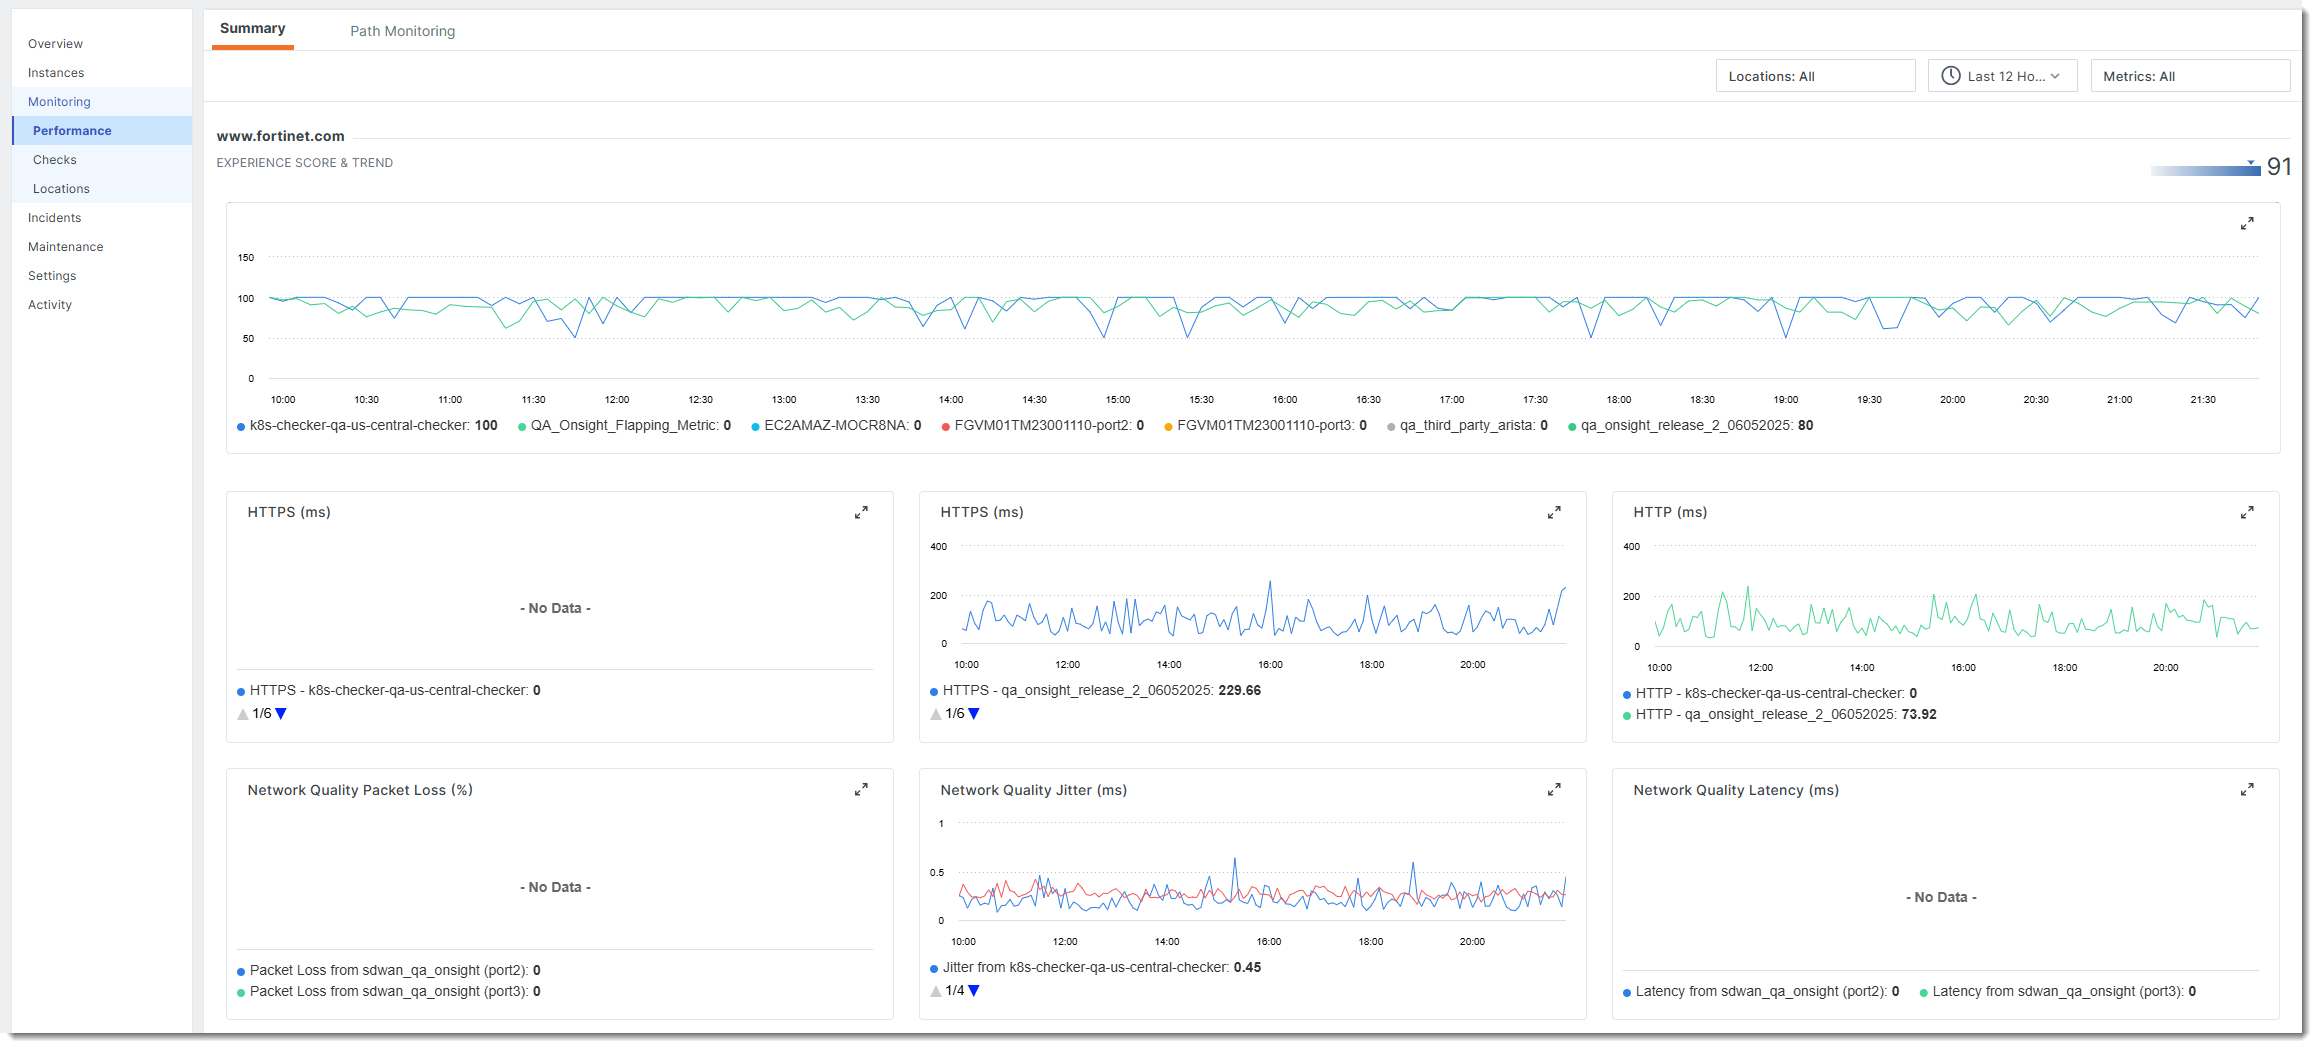
Experience score and trends
Open an application and on its page, you will see the UX score displayed alongside the application’s availability at the top of the page.
For a more detailed view, navigate to Monitoring > Performance. This page displays the Experience score and trends in a line graph. You can filter the graph by location and time range to focus on specific data.
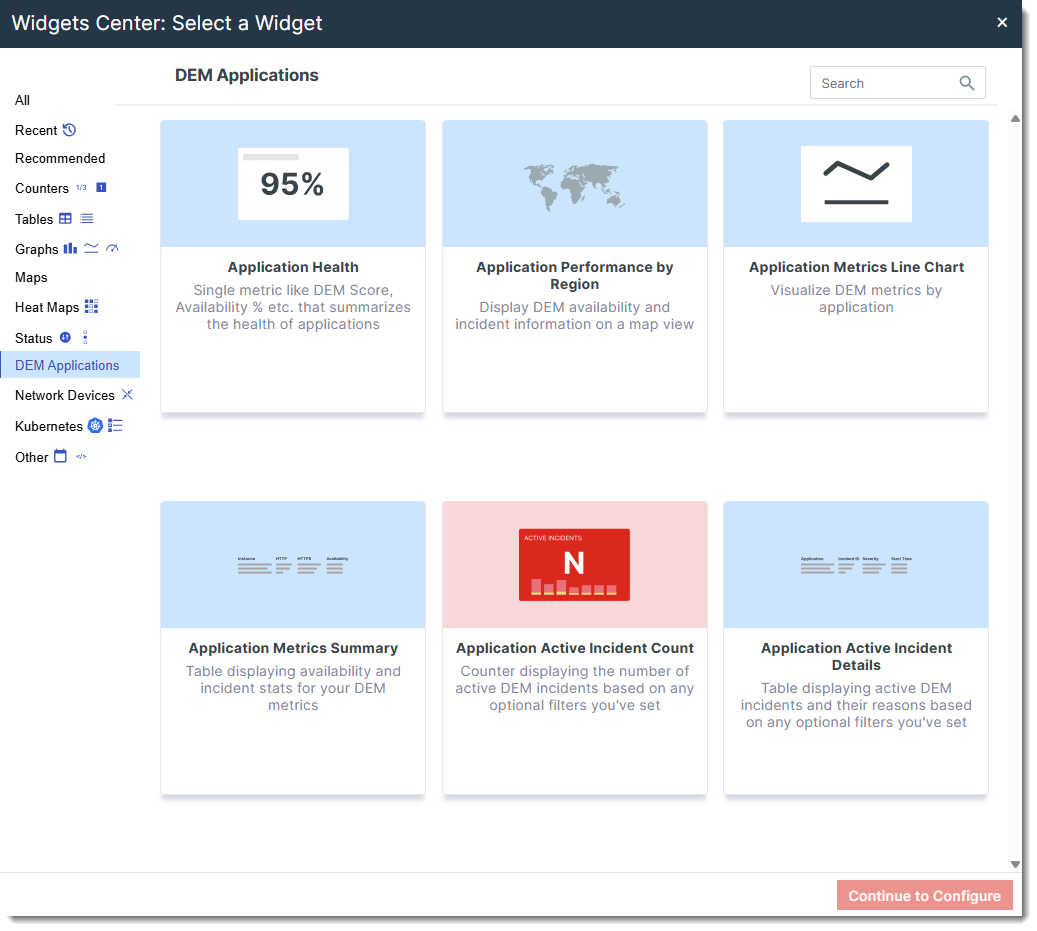
Dashboard widgets for UX score
The following widgets can be used to display application health and performance using the UX Score. Click each link below to view detailed descriptions and configuration instructions for each widget.