
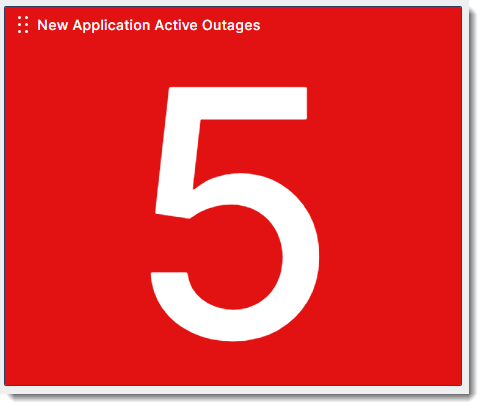
Application Active Incident Counter
The Application Active Incident Counter widget displays the count of all active incidents in your applications. You can filter which incidents are included based on specific metric types or severity.
|
|
The Application Active Incident Counter widget is limited to displaying incidents that are up to 1 year old. Incidents older than 1 year will not appear in the widget. |
Configuration
|
Field |
Description |
|---|---|
|
Widget Name |
Name of the widget as it appears on the dashboard. |
|
Application |
Select the application or applications you want to include in the widget. |
|
Metrics |
Add the metrics that you want to include in the calculation of total incidents. |
|
Additional Metric Filters |
Filter by tag or by option string. |
|
Incident Tags |
Filter by Incident Tag. Values:
|
|
Severity Levels |
Select which severity level will be included in the calculated number of incidents. For example, selecting Critical displays the number of all critical incidents. Values:
|
|
Background Color |
Select a background color. |
|
Monitoring Location Type |
Select the location types to include in the widget. Only the selected locations will contribute to the metric calculations. Values:
|
| Hide Acknowledged Incidents | Turn on to hide acknowledged incidents. |
| Hide Incidents Under Maintenance | Turn on to hide incidents currently under maintenance. |
| Hide Incident History | Turn on to hide past incidents. |