The Instance Details page shows all of the relevant information about the instance, including the instance performance, monitoring configuration, incidents, maintenance schedules, availability, and more. The Instance Details page supports several actions to manage the instance metrics, maintenance, and if installed, the FortiMonitor Agent and CounterMeasures. Performance-based graphs are displayed in the Performance section of the Instance Details page to help you visualize the status of each metric configured for the instance.
The Instance Details page is divided into several sections and tabs. Go through the following sections to learn more.
Availability
The Availability section shows the availability of the instance in a 24-hour, 7-day, or 30-day time range.
Actions
This section lists all of the actions that you can perform from the Instance Details page. Note that depending on the type of instance, some actions may not be available. Select the 3-dot icon to see the full list of actions available to the instance.
-
Flush DNS– Forces a DNS update after an IP address change.
-
Delete Instance – Select the Delete Instance button to remove the instance from FortiMonitor.
For network devices, you can initiate port discovery by clicking the Port Scan button.

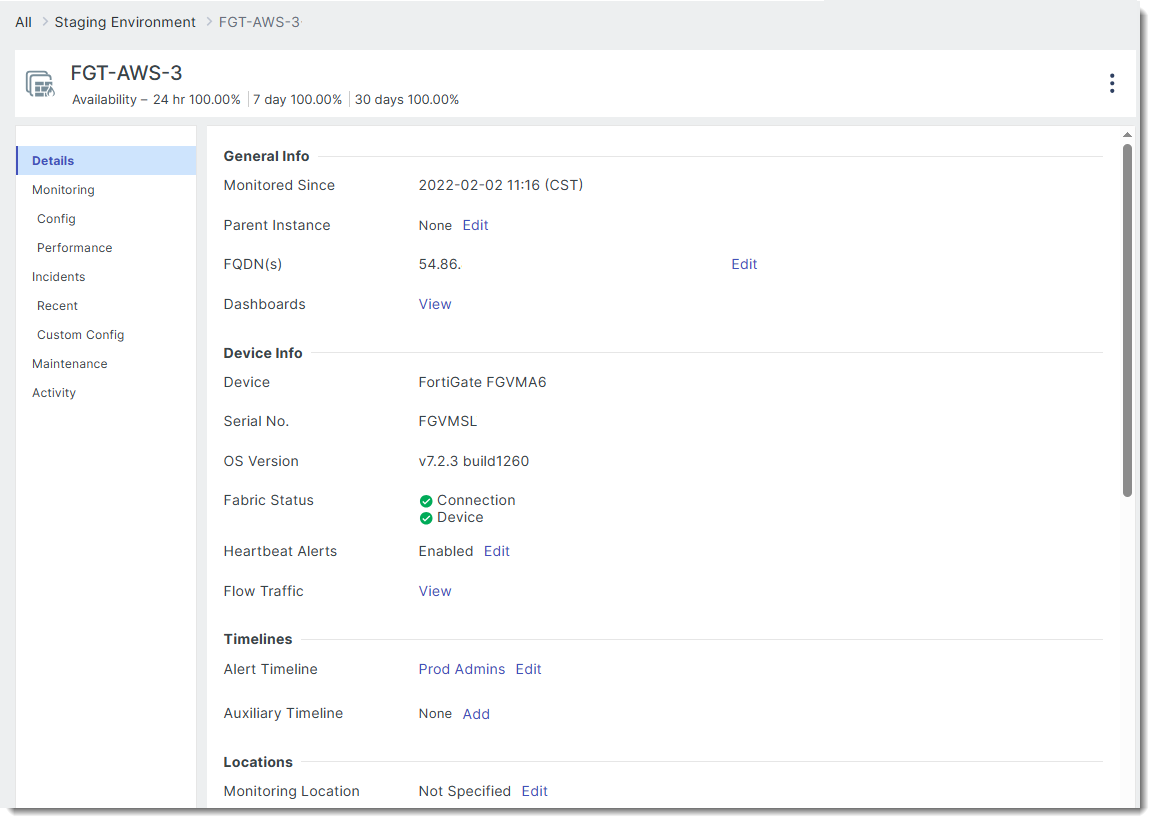
Details tab
General information
|
Field |
Description |
|---|---|
|
Monitored Since |
The date and time when this instance began being actively monitored. |
|
Server Key |
Unique identifier assigned by FortiMonitor to the instance. |
|
Parent Instance |
Primary instance to which this instance is linked. |
|
Agent Status |
The status of the FortiMonitor Agent, including the Agent's version, last sync, heartbeat alerts, CounterMeasures status, and last metadata build. If no Agent is installed on the instance, you may click Install to install a supported Agent. |
|
FQDN(s) |
Fully Qualified Domain Names (FQDNs) associated with this instance. |
|
Dashboards |
Links to dashboards where this instance is included. |
|
CounterMeasures (Enable/Disable) |
Click Edit on any of the fields to show the Instance Configuration drawer. Enable or disable CounterMeasures on this instance from this drawer. |
Device information (Fabric devices)
Available for Fabric devices only.
|
Field |
Description |
|---|---|
|
Device |
The name of the hardware device. |
|
Serial No. |
The unique serial number assigned to the hardware device by the manufacturer. |
|
OS Version |
The current operating system version running on the hardware device. |
|
Fabric Status |
Indicates the device's connectivity and health with the Fabric. Click Rediscover to run discovery for Fabric devices. |
|
Heartbeat Alerts |
Enable or disable heartbeat alerts. |
|
Flow Traffic |
View data showing the volume and pattern of network traffic flowing through the device. |
Device information (SNMP devices)
Available for Fabric devices only.
|
Field |
Description |
|---|---|
|
Device |
The name of the hardware device. |
| SNMP Description | A text description retrieved via SNMP that typically includes details about the device. |
| SNMP Location | The physical or logical location of the device as reported via SNMP. |
| SNMP Credential | SNMP credential used by the device. Click Edit to change the credential. |
| Flow Traffic |
View data showing the volume and pattern of network traffic flowing through the device. |
| Port Discovery |
Shows port discovery status. For example: Result — success Last Discovery Time — 2020-08-13 12:43:13 (CDT) Ports Discovered — 59 Port Scan — Request Port Scan |
Timelines
|
Field |
Description |
|---|---|
|
Alert Timeline |
The Alert Timeline associated with this instance. |
|
Auxiliary Timeline |
The auxiliary Alert Timeline associated with this instance. |
Locations
|
Field |
Description |
|---|---|
| Monitoring Location |
The public checker or OnSight vCollector used to monitor this instance. |
| Geo Location |
Location entered in this field is used in Geomap widgets. Latitude and longitude are entered in degrees, with + values corresponding to north latitude and east longitude, and - values corresponding to south latitude and west longitude. |
Settings
|
Field |
Description |
|---|---|
| Instance Group |
The group where this instance belongs to. |
| Templates |
The templates applied to this instance. |
| Tags |
The tags applied to this instance. Click Edit to add or remove tags. |
| Attributes |
The attributes applied to this instance. Click Edit to add or remove attributes. |
| Flapping Incident |
Click Configure to set the flapping incident threshold for this instance. |
Others
|
Field |
Description |
|---|---|
| Prometheus Endpoints |
Add or remove Prometheus endpoints. |
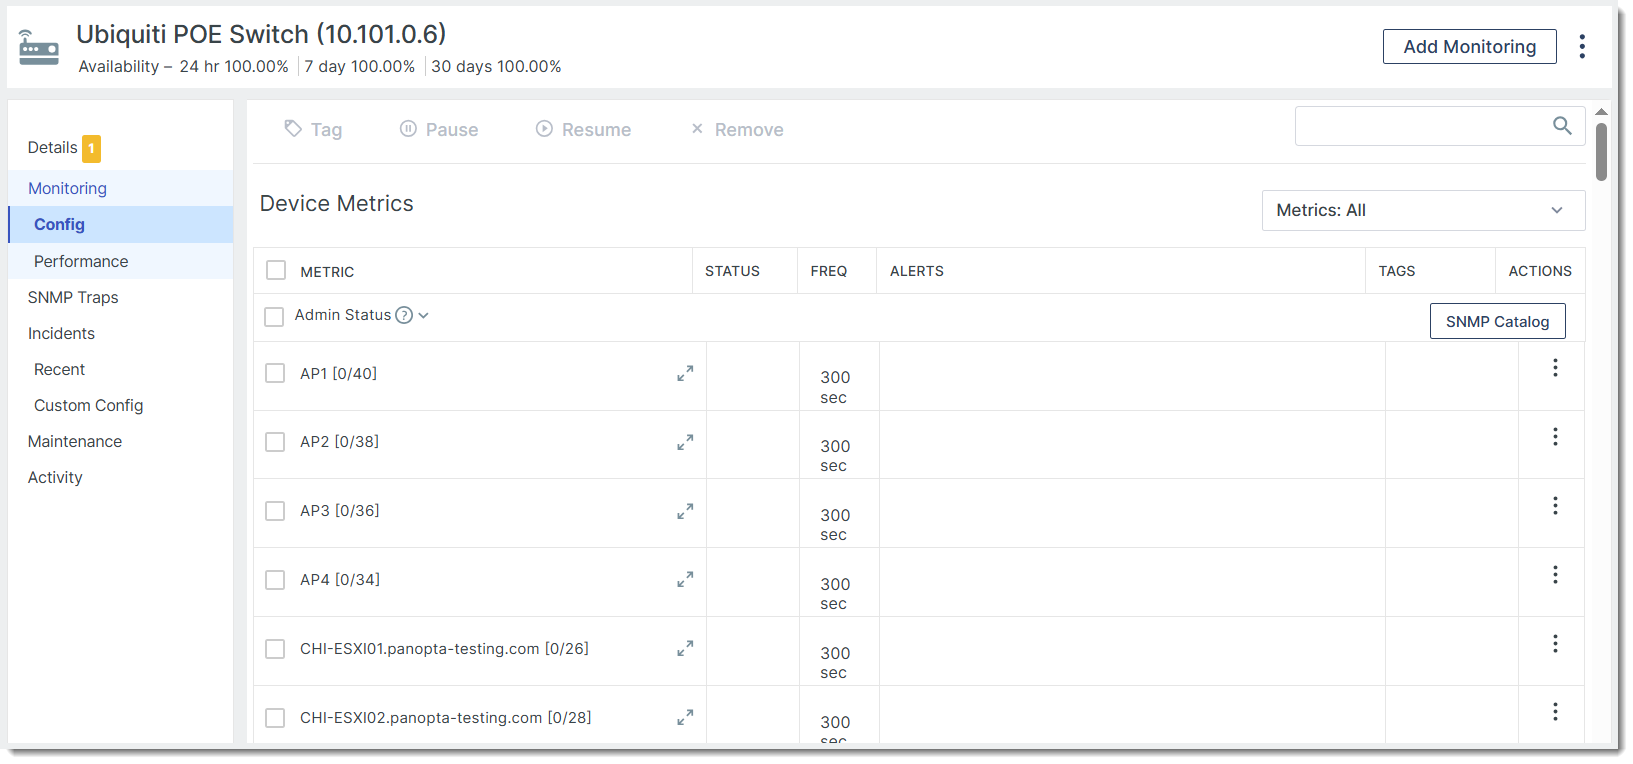
Monitoring tab
Config
The Config section shows all of the metrics configured for this instance. You can add monitoring and configure metrics from this section.
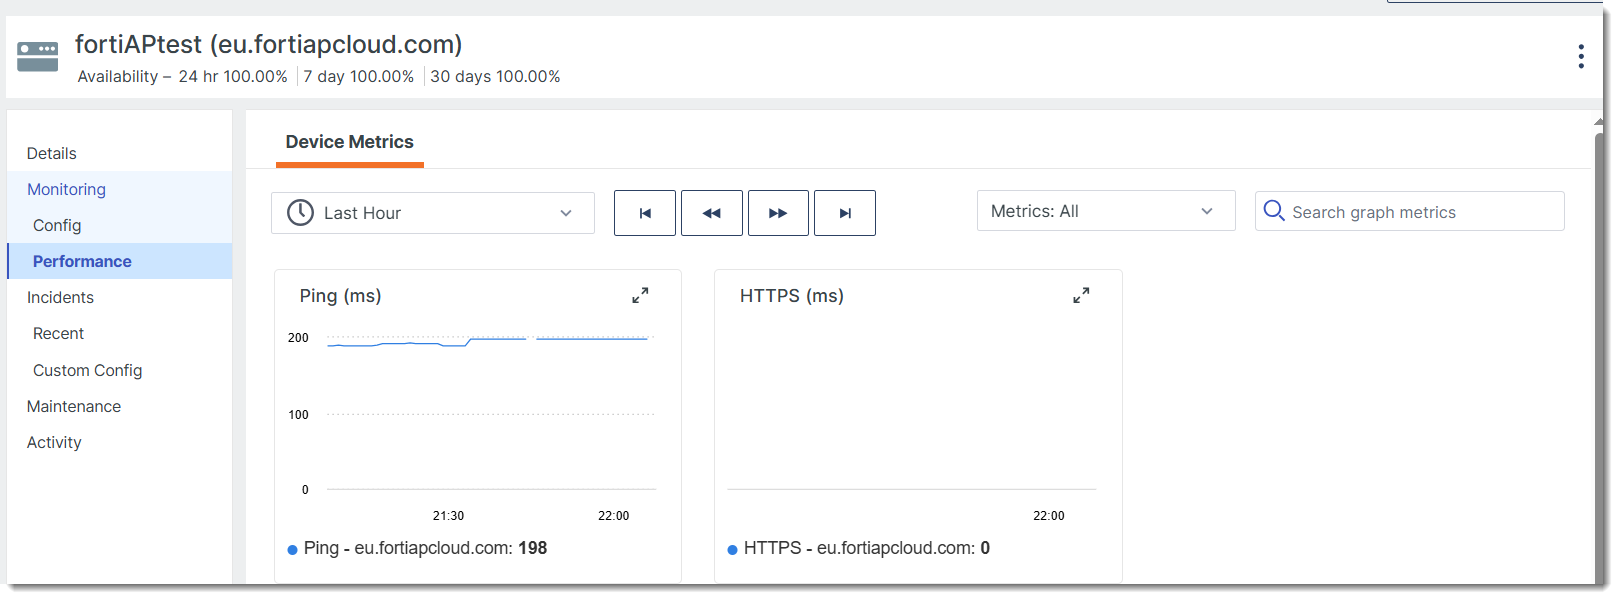
Performance
The Performance section provides a visual representation of the status of the instance. Each metric is represented by a line graph that can be filtered based on the metric type and scoped using a specific time range.
Incidents tab
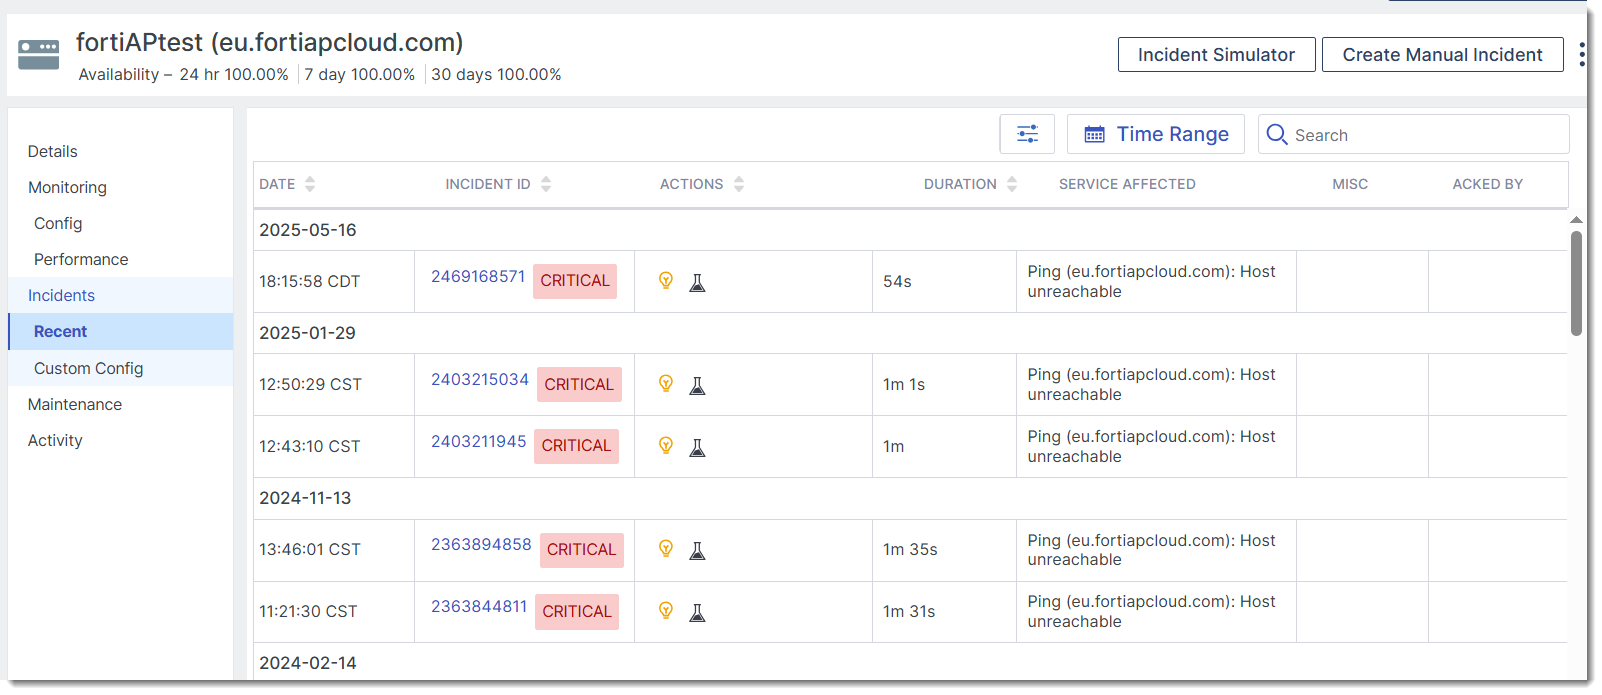
Recent
The Recent section shows you a summary of all the incidents, whether active or resolved, for this instance. You can filter the list of incidents by selecting a severity type and by setting a time range. You can also create manual incidents and run incident simulations from this tab.
Custom config
The Custom Config section shows a list of created custom incident types. You can also add an incident type from this tab.
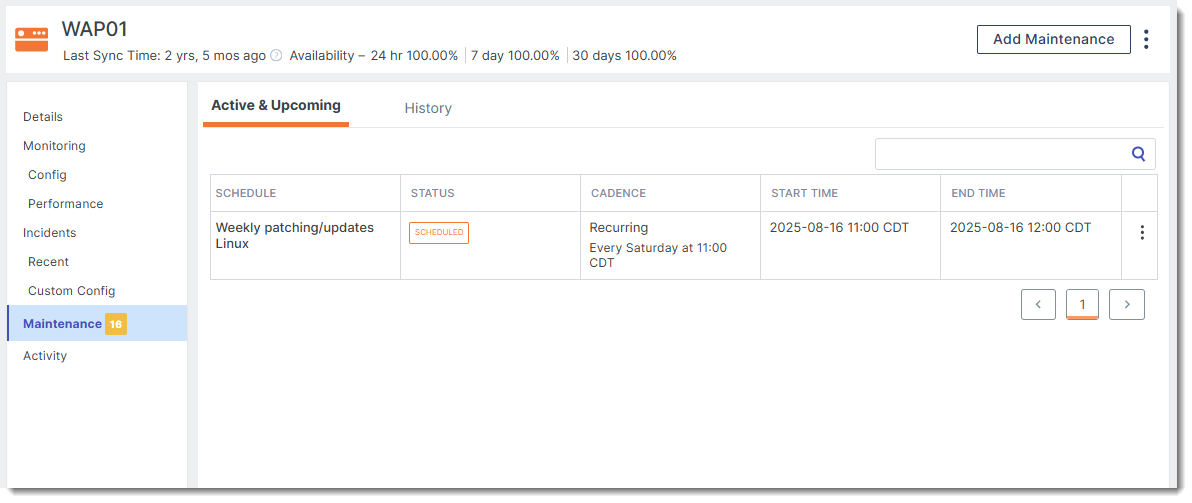
Maintenance
The Maintenance section shows all active and upcoming maintenance on the instance.
-
Add Maintenance– Create a maintenance period for this instance.
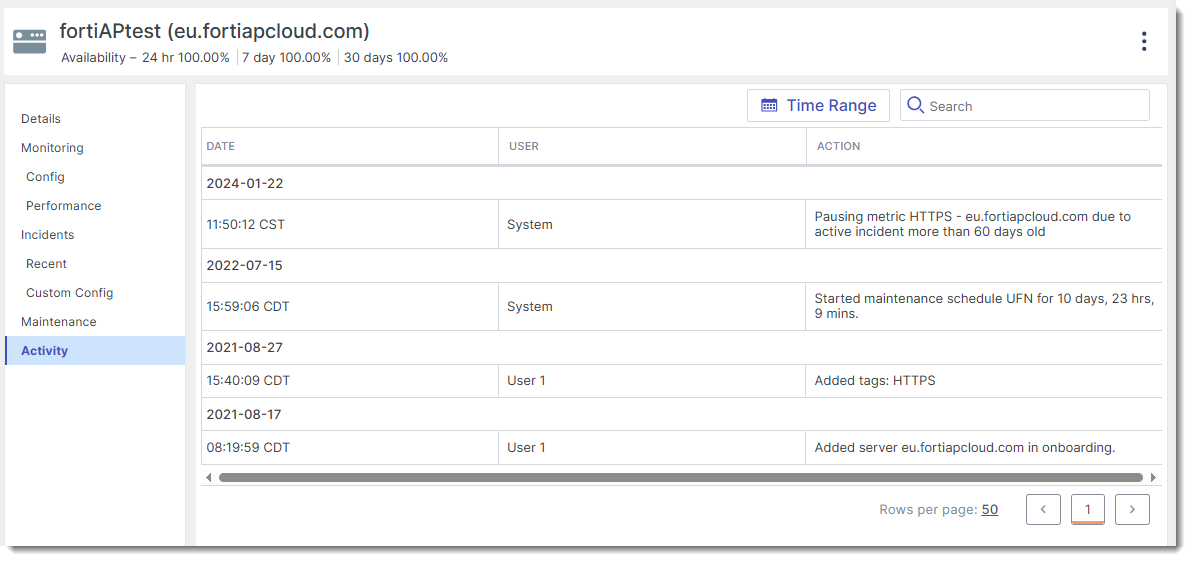
Activity
The Activity tab provides a log of all actions performed on the instance. The initiator of the action, the date, and the action performed are detailed in the Activity Log table.