
Using a session table
A session is a communication channel between two devices or applications across the network. Sessions allow FortiOS to inspect and act on a sequential group of packets in a session all at once instead of inspecting each packet individually. Each session has an entry in the session table that includes important information about the session.
You can view FortiGate session tables from the FortiGate GUI or CLI. The most useful troubleshooting data comes from the CLI. The session table in the GUI also provides useful summary information, particularly the current policy number that the session is using.
When to use a session table
Session tables are useful when verifying open connections. For example, if you have a web browser open to browse the Fortinet website, you would expect a session entry from your computer on port 443 to the IP address for the Fortinet website.
You can also use a session table to investigate why there are too many sessions for FortiOS to process.
To view session information in the GUI, go to Dashboard > FortiView Sessions. This view requires that a logging device is configured, and traffic log is enabled on a policy.
Finding the security policy for a specific connection
Every application or device that connects to another application or device must open a communication channel to exchange information. A stateful firewall tracks these sessions to ensure only packets exchanged in accordance to the session state are allowed to pass through the firewall. This includes verifying there is a policy match for such traffic, where features such as NATing, UTM scanning, and traffic shaping can be applied. Each session will have an entry in the session table.
If a secure web browser session is not working properly, you can check the session table to ensure the session is still active and going to the proper address. The session table can also tell you the security policy number it matches, so you can check what is happening in that policy.
1. Get the connection information.
To identify the session you want, you may need:
- The source IP address
- The destination IP address
- The port number used by the protocol. Common ports are:
- Port 443 (HTTPS for SSL encrypted web browsing)
- Port 22 (SSH for Secure Shell)
- Port 25 (SMTP for Mail Transfer)
2. Find the session and policy ID
Go to Dashboard > FortiView Sessions. You can filter on each column header or you can type in a search by filterable columns.
For example, to filter on source, destination and port number, either go to each column header and select your value, or go to the search bar and select the column name and value one by one.
Additionally, you can select more columns to display by mousing over the column header, and clicking on the gear icon that displays.
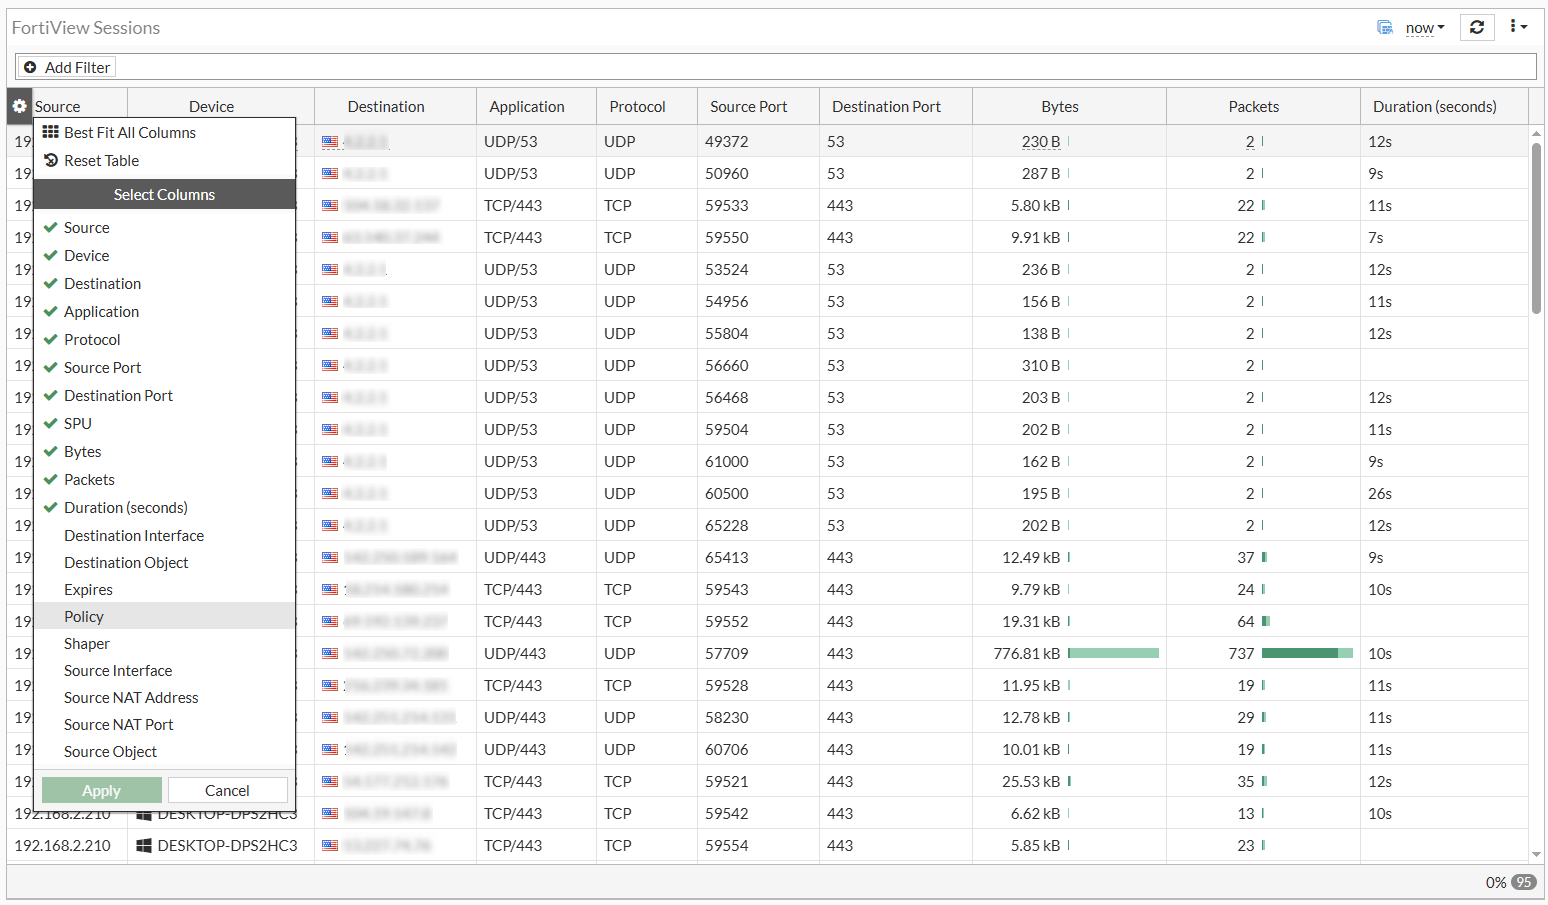
This menu allows you to add or remove columns.
Select Policy to add Policy to the view and click Apply. You can now identify the policy ID based on your search criteria.
CLI
Alternatively, instead of using the GUI you can also view the sessions from the CLI. The CLI has many filtering options and it displays granular information about each session.
To view session data in the CLI:
diagnose sys session list
To filter session data:
diagnose sys session filter <option>
The values for <option> include the following:
|
Value |
Definition |
|---|---|
|
|
Clear session filter |
|
|
Destination interface |
|
|
Destination port |
|
|
Destination IP address |
|
|
Duration of the session |
|
|
Expire |
|
|
Add a source address to the extended match list. |
|
|
Add a destination address to the extended match list. |
|
|
Add a source address to the negated extended match list. |
|
|
Add a destination address to the negated extended match list. |
|
|
Inverse filter |
|
|
NAT'd source port |
|
|
NAT'd source ip address |
|
|
Policy ID |
|
|
Protocol number |
|
|
Protocol state |
|
|
Session state1 |
|
|
Session state2 |
|
|
Source interface |
|
|
Source port |
|
|
Source IP address |
|
|
Index of virtual domain, |
|
vd-name |
Name of virtual domain. |
An example of a TCP session:
# diagnose sys session list
session info: proto=6 proto_state=11 duration=59 expire=3586 timeout=3600 refresh_dir=both flags=00000000 socktype=0 sockport=443 av_idx=9 use=5
origin-shaper=low-priority prio=4 guarantee 0Bps max 131072000Bps traffic 1826Bps drops 0B
reply-shaper=low-priority prio=4 guarantee 0Bps max 131072000Bps traffic 1826Bps drops 0B
per_ip_shaper=
class_id=0 shaping_policy_id=2 ha_id=0 policy_dir=0 tunnel=/ vlan_cos=0/255
state=redir local may_dirty os rs url_cat_valid
statistic(bytes/packets/allow_err): org=10941/16/1 reply=3633/11/1 tuples=3
tx speed(Bps/kbps): 0/0 rx speed(Bps/kbps): 0/0
orgin->sink: org pre->post, reply pre->post dev=6->3/3->6 gwy=172.19.50.1/0.0.0.0
hook=post dir=org act=snat 192.168.2.210:49397->54.177.212.176:443(172.19.50.87:49397)
hook=pre dir=reply act=dnat 54.177.212.176:443->172.19.50.87:49397(192.168.2.210:49397)
hook=post dir=reply act=noop 54.177.212.176:443->192.168.2.210:49397(0.0.0.0:0)
pos/(before,after) 0/(0,0), 0/(0,0)
misc=0 policy_id=9 pol_uuid_idx=15905 auth_info=0 chk_client_info=0 vd=0
serial=000016a0 tos=40/40 app_list=0 app=0 url_cat=142
rpdb_link_id=00000000 ngfwid=n/a
npu_state=0x000100
no_ofld_reason:  redir-to-av
In the above example, a TCP/443 session is opened between the source (192.168.2.210) and the destination fortinet.com (54.177.212.176). To further understand the information, we will examine some fields in the output.
Session info:
session info: proto=6 proto_state=11 duration=59 expire=3586 timeout=3600 refresh_dir=both flags=00000000 socktype=0 sockport=443 av_idx=9 use=5
|
Session info field |
Description |
|---|---|
|
proto |
The protocol number. Common protocols used are: ICMP (proto 1) TCP (proto 6) UDP (proto 17) |
|
proto_state |
The state of the connection with respect to their protocol. |
|
duration |
Duration of the session (value in seconds). |
|
expire |
A countdown from the 'timeout' since the last packet passing via session (value in seconds). |
|
timeout |
An indicator of how long the session can stay open in the current state (value in seconds). |
Session state:
state=redir local may_dirty os rs url_cat_valid
|
State |
Explanation[KL1] |
|---|---|
|
may-dirty |
Session details are allowed to be altered. |
|
dirty |
The session has been altered (requires may-dirty). |
|
npu |
The session goes through an acceleration ship. |
|
npd |
The session is denied for hardware acceleration. |
|
npr |
The session is eligible for hardware
acceleration (more information with |
|
rem |
The session is allowed to be reset in case of a memory shortage. |
|
eph |
The session is ephemeral. |
|
oe |
The session is part of the IPsec tunnel (from the originator). |
|
re |
The session is part of the IPsec tunnel (from the responder). |
|
local |
The session is attached to the local FortiGate IP stack. |
|
br |
The session is bridged (VDOM is in transparent mode). |
|
redir |
The session is redirected to an internal FortiGate proxy. |
|
wccp |
The session is intercepted by wccp process. |
|
nlb |
The session is from a load-balanced vip. |
|
log |
The session is being logged. |
|
log-start |
The session is being logged when it starts as
well
(generate two logs for one session, |
|
os |
The session is shaped in the origin direction. |
|
rs |
The session is shaped by the reply direction. |
|
ndr |
The session is inspected by IPS signature. |
|
nds |
The session is inspected by IPS anomaly. |
|
auth |
The session is subject to authentication. |
|
authed |
The session was successfully authenticated. |
|
block |
The session was re-evaluated to block (policy changed). |
|
ext |
(Deprecated) The session is handled by a session helper. |
|
app_ntf |
Session matched a policy entry that contains
|
|
F00 |
After enabling traffic log in policy, the session will have this flag. |
|
pol_sniff |
After enabling packet capture in policy, session will have this flag. |
|
rst_tcp |
Flag visible when firewall policy has
|
|
synced |
The session has been synchronized to HA peers, as seen on session-pickup enabled master. |
|
syn_ses |
The session has been synchronized from master to this peer, as seen on session-pickup enabled backup or HA-peer device. |
|
need_sync |
With 30 second HA sync delay. The session will be synced when reaching 30 seconds of lifetime. |
|
complex |
The session is handled by a session helper. |
|
app_valid |
The relevant rule has app control profile applied and FortiGate IPS engine was able to identify the application. (The session will have a field such as app= indicating the application.) |
|
url_cat_valid |
The relevant rule has web filter profile
applied and FortiGate was able to identify the web category. (The session will have
a field such as |
Traffic directions:
orgin->sink: org pre->post, reply pre->post dev=6->3/3->6 gwy=172.19.50.1/0.0.0.0
hook=post dir=org act=snat 192.168.2.210:49397->54.177.212.176:443(172.19.50.87:49397)
hook=pre dir=reply act=dnat 54.177.212.176:443->172.19.50.87:49397(192.168.2.210:49397)
hook=post dir=reply act=noop 54.177.212.176:443->192.168.2.210:49397(0.0.0.0:0)
dev=6->3/3->6 indicates the ingress and egress interfaces in both directions. The device and interface index can be obtained from:
# diagnose netlink interface list
In this case:
# diagnose netlink interface list | grep “index=6 “
if=port2 family=00 type=1 index=6 mtu=1500 link=0 master=0

# diagnose netlink interface list | grep "index=3 "
if=port1 family=00 type=1 index=3 mtu=1500 link=0 master=0
gwy=172.19.50.1/0.0.0.0 indicates the gateway used in the original direction.
The next two lines display the source and destination, and NAT'd address in each direction:
<source_IP>:<source_port>-><destination_IP>:<destination_port>(<NAT_IP>:<NAT_port>)
Miscellaneous:
misc=0 policy_id=9 pol_uuid_idx=15905 auth_info=0 chk_client_info=0 vd=0
serial=000016a0 tos=40/40 app_list=0 app=0 url_cat=142
rpdb_link_id=00000000 ngfwid=n/a
npu_state=0x000100
no_ofld_reason:  redir-to-av
|
Misc fields |
Description |
|---|---|
|
policy_id |
Policy ID matching this session |
|
pol_uuid_idx |
Policy index |
|
auth_info |
Indicates if the session holds any
authentication data ( |
|
vd |
VDOM index. In the case where multiple VRFs are configured, VRF IDs can be obtained from the VD value:
|
|
reflect info |
If this exists, it indicates an auxiliary or reflect session that created for the existing session. |
|
npu_state |
Provides the offloading details for the
session, with the flag field which indicates whether this session is handling
regular traffic ( |
|
no_ofld_reason |
The reason this session is not offloaded
to NPU. For example, |
Protocol states
Each protocol has its unique state which the firewall learns by examining the protocol headers. It is important for the firewall to keep the protocol state in order to anticipate the next packet it receives and to reject any unsolicited packets.
ICMP (proto 1)
There are no states for ICMP. It always shows proto_state=00.
TCP (proto 6)
The proto_state is a 2-digit number because the FortiGate is a keeps track of both directions of the session. The state values are:
|
State |
Value |
|---|---|
|
NONE |
0 |
|
ESTABLISHED |
1 |
|
SYN_SENT |
2 |
|
SYN & SYN/ACK |
3 |
|
FIN_WAIT |
4 |
|
TIME_WAIT |
5 |
|
CLOSE |
6 |
|
CLOSE_WAIT |
7 |
|
LAST_ACK |
8 |
|
LISTEN |
9 |
UDP (proto 17)
Even though UDP is a stateless protocol, FortiGate keeps track of the following states:
|
State |
Value |
|---|---|
|
UDP Reply not seen |
0 |
|
UDP Reply seen |
1 |
Examples
To examine the firewall session list in the CLI:
You can use a filter to limit the sessions displayed by source, destination address, port, or NAT'd address. To use more than one filter, enter a separate line for each value.
The following example filters the session list based on a source address of 10.11.101.112:
FGT# diagnose sys session filter src 10.11.101.112
FGT# diagnose sys session list
The following example filters the session list based on a destination address of 172.20.120.222.
FGT# diagnose sys session filter dst 172.20.120.222
FGT# diagnose sys session list
To clear all sessions corresponding to a filter:
FGT# diagnose sys session filter dst 172.20.120.222
FGT# diagnose sys session clear
Checking source NAT information
Checking source NAT is important when you are troubleshooting from the remote end of the connection outside the firewall.
To check the source NAT information in the CLI:
When you display the session list in the CLI, you can match the NAT'd source address (nsrc) and port (nport). This is useful when multiple internal IP addresses are NAT'd to a common external-facing source IP address.
FGT# diagnose sys session filter nsrc 172.20.120.122
FGT# diagnose sys session filter nport 8888
FGT# diagnose sys session list