


Path monitoring
The path monitoring feature allows you to look into the reachability of target instances from one or more sources. The source can be OnSights, DEM Agents (MacOS and Windows), or public checkers. Path monitoring also features a timescale selector that allows you to see the results of a path recorded at any point in time.
Prerequisites
-
FortiMonitor Windows Agent 23.3.7
-
FortiMonitor MacOS Agent 2023.03.11247
-
OnSight vCollector 23.3.7
Note: Path monitoring is currently only available for DEM applications.
Configure Path Monitoring
To configure path monitoring, perform the following steps:
-
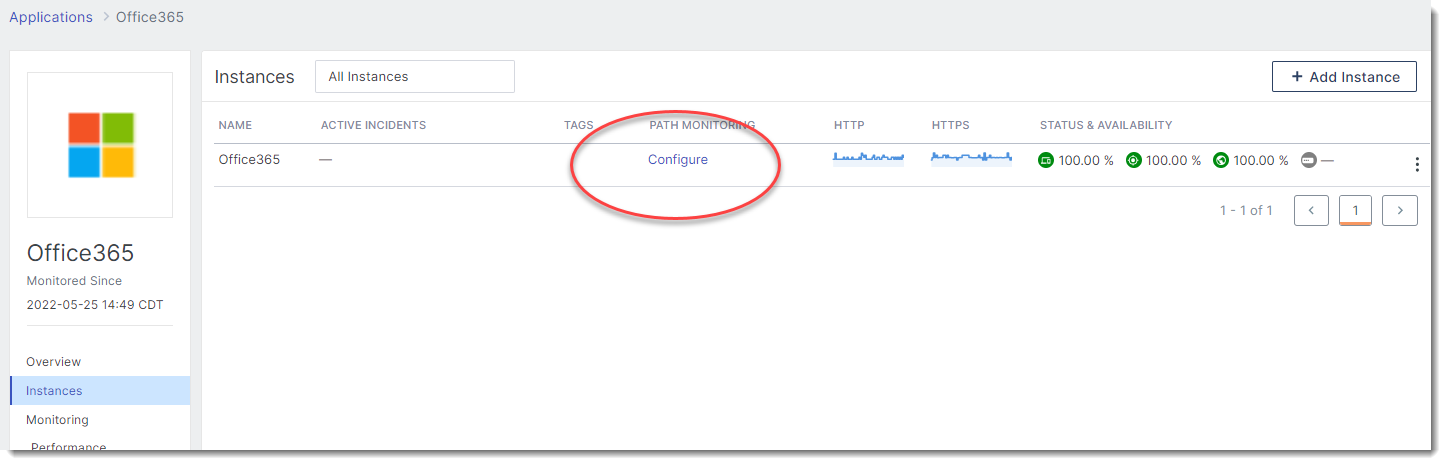
From the navigation menu Select Monitoring > Applications.
-
Open an Application.
-
Click Instances.
-
Choose the instance that you want to configure then click Configure. The configuration drawer will slide out.
-
Enable Path Monitoring and set the frequency.

-
Click Save.
Change an existing configuration
To change an existing configuration, perform the following steps:
-
From the navigation menu Select Monitoring > Applications.
-
Open an Application.
-
Click Instances.
-
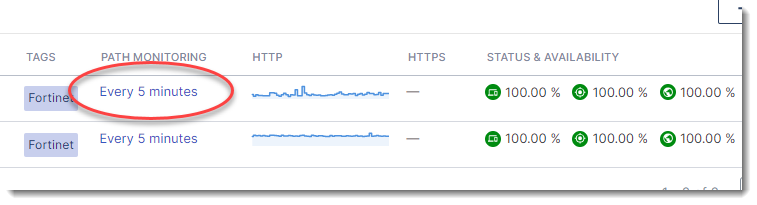
Choose the instance that you want to update then click the Path Monitoring link. Configure. The configuration drawer will slide out.
-
From here you can disable Path Monitoring or change the frequency.
-
When you are done, click Save.
View Path Monitoring
To see the configured path monitoring, perform the following steps:
-
1. From the navigation menu Select Monitoring > Applications.
-
2. Open an Application.
-
3. Select Performance.
-
4. Click the Path Monitoring tab.

Timescale selector, filters, and toggles
Timescale selector and date
The timescale selector and date selector allow you to see the results of a path from all of the sources to the target instance at any point of time. If there are multiple instances in an application, the path for each target is shown as well. Select a date or slide the selector to any point in the timescale to see the results.
Filters and toggles
The following filters and toggles are available:
-
Source – Toggle to display source icons
-
Identified Node – Toggle to display nodes that have been identified
-
Unidentified Node – Toggle to display not that are not identified
-
Node with incidents – Toggle to display nodes with active incidents
-
Link with packet loss – Toggle to display links or paths with packet loss. These links are in red.
-
Target – Toggle to display targets
-
Node Name/IP – Hide/unhide the name or IP address of nodes
-
Legend – Hide/unhide the toggles
-
Locations – Select which locations are shown/hidden
You can also use the search box to search for and display specific networks, locations, or targets.
View node details
You can view the details of a source, destination, or hop node by moving the cursor to a particular node.
The following details are displayed:
-
Type of node (source, destination, or hop)
-
Provider
-
Location
-
For source nodes, the number of hops taken to reach the destination is also displayed.
View link details
You can view the details of link by moving the cursor to a particular link.
The following details are displayed:
-
Packet loss
-
Latency
Links with packet loss are highlighted in red.