
MSSQL
The MSSQL plugin allows you to monitor a number of useful metrics on your database servers. You can select the MSSQL from the monitoring catalog,
MSSQL Server Configuration
|
|
If you installed MSSQL as a ‘Named Instance’ there will be extra configuration changes in the C:\Program File\PanoptaAgent\Agent.config, you need to make sure your MSSQL install is not running as a named instance. If it is, please follow the guidelines for getting the correctly named metrics with Perfmon here. |
Get the instance named category which in this case will be ‘MSSQL$SQLEXPRESS:Locks” yours may be something different such as “MSSQL$EXPRESS”:
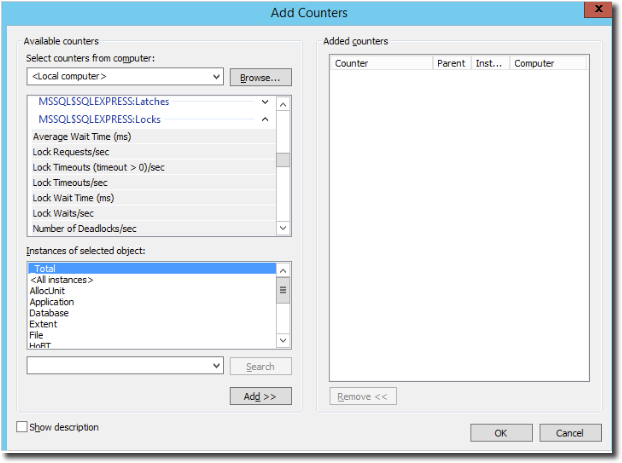
Then make sure to grab the exact label name. In this case it is “Number of Deadlocks/sec” it is important to make sure to get this exactly as it is case sensitive and make not read properly if copied incorrectly:
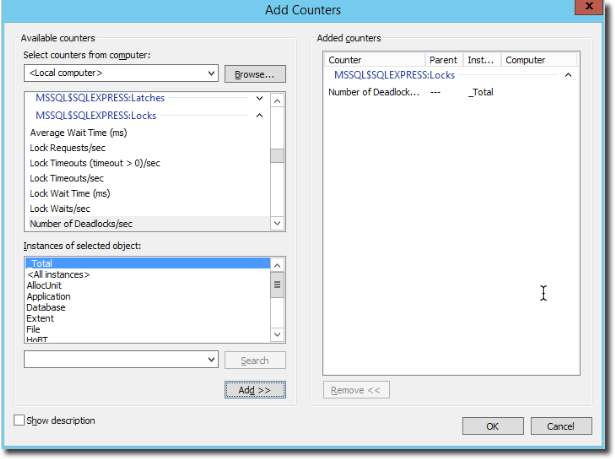
Make sure to grab the correct categories and add them. They will look similar to the text below. You can choose to do a find and replace of the plugin categories but the labels should be the same.
<resource category="MSSQL$SQL2012:Databases" label="Repl. Trans. Rate" unit="transactions" />
<resource category="MSSQL$SQL2012:Databases" label="Shrink Data Movement Bytes/sec" unit="bytes" />
<resource category="MSSQL$SQL2012:Databases" label="Tracked transactions/sec" unit="transactions" />
<resource category="MSSQL$SQL2012:Databases" label="Transactions/sec" unit="transactions" />
<resource category="MSSQL$SQL2012:Databases" label="Write Transactions/sec" unit="transactions" />
<resource category="MSSQL$SQL2012:Locks" label="Number of Deadlocks/sec" />
Control Panel Configuration
To add a MSSQL agent resource to your server first see Add FortiMonitor Agent checks if you have not already.
Select Microsoft SQL server from the monitoring catalog.
There are a number of metrics available to be monitored.
|
Metric |
Unit |
|---|---|
|
Active jobs |
|
|
Active steps |
|
|
Active transactions |
|
|
Backup/Restore Throughput/sec |
reads/writes |
|
Batch Requests/sec |
requests |
|
Buffer cache hit ratio |
ratio |
|
Bulk copy rows/sec |
row |
|
Bulk copy throughput/sec |
kilobytes |
|
Checkpoint pages/sec |
pages |
|
Commit table entries |
kilobytes |
|
Compilations/sec |
comps |
|
Data file(s) size KB |
kilobytes |
|
DBCC Logical scan bytes/sec |
bytes |
|
Deadlocks/sec |
|
|
Failed jobs |
|
|
Log cache hit ratio |
ratio |
|
Log cache reads/sec |
reads |
|
Log file(s) size KB |
kilobytes |
|
Log file(s) used size KB |
kilobytes |
|
Log flush wait time |
milliseconds |
|
Log flush waits/sec |
commits |
|
Log flushes/sec |
flushes |
|
Log growths |
growths |
|
Log pool cache misses/sec |
misses |
|
Log pool disk reads/sec |
reads |
|
Log pool requests/sec |
requests |
|
Log shrinks |
shrinks |
|
Log truncations |
truncations |
|
Memory grants pending |
|
|
Page life expectancy |
seconds |
|
Page splits/sec |
splits |
|
Percent log used |
% |
|
Processes blocked |
processes |
|
Queued steps |
|
|
Re-Compilations/sec |
re-comps |
|
Repl. Pending Xacts |
transactions |
|
Repl Trans. Rate |
transactions |
|
Shrink data movement bytes/sec |
bytes |
|
Successful jobs |
|
|
Tracked transactions/sec |
transactions |
|
Transaction delay |
milliseconds |
|
Transactions/sec |
trans |
|
User connections |
connections |
|
Write transactions/sec |
transactions |
The specific number that this resource returns is defined by the above options, please take this into account if you choose to change your Alert Threshold for this resource.