
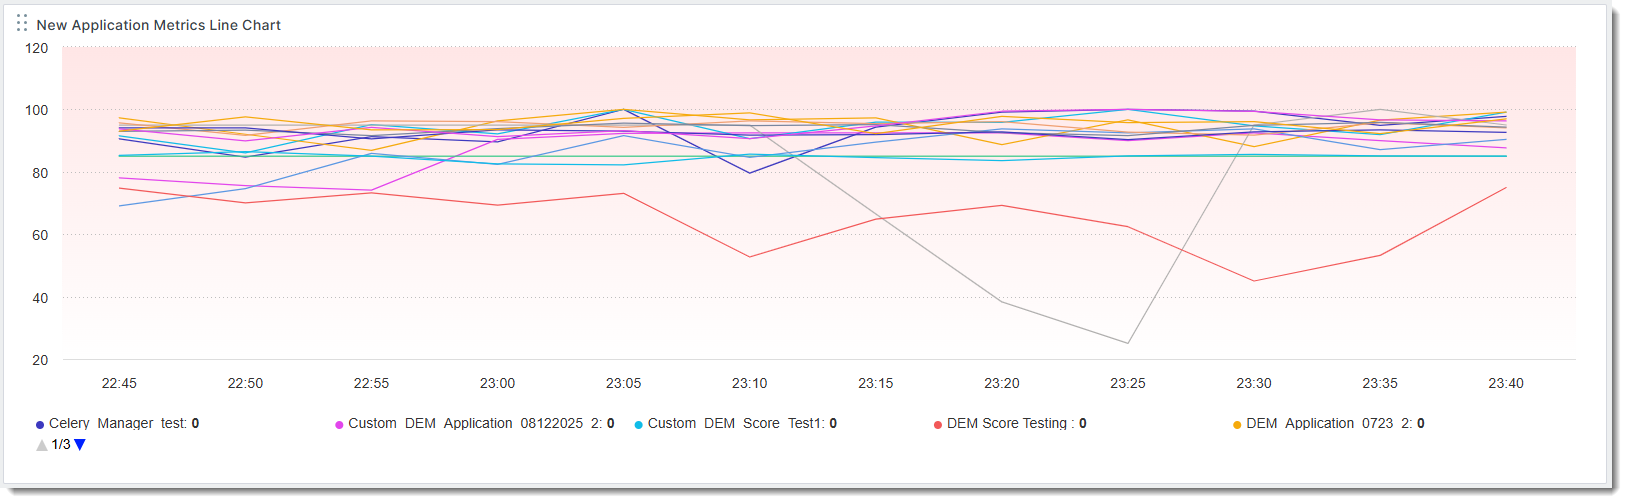
Application Metrics Line Chart
The Application Metrics Line Chart visualizes DEM metrics for each application over time.
Configuration
When creating or editing a widget, a drawer that shows the widget's configuration options slides out from the right. Each configurable option is described in the following table.
|
Field |
Description |
|---|---|
|
Widget Name |
Name of the widget as it appears on the dashboard. |
|
Application |
Select the application or applications you want to include in the widget. |
|
Metrics |
Select one or more metrics to include in the widget. Values:
|
|
Time Range |
The time range for the trendline. Values:
|
|
Monitoring Location Type |
Select the location types to include in the widget. Only the selected locations will contribute to the metric calculations. Values:
|
|
Graph Options |
Additional options for the line graph. Values:
|
|
Title Hyperlink |
Enter a valid dashboard URL. |
|
Time Comparison |
Compare the trendline to its historical values. A dotted line represents historical values. Values:
|
|
Background Color |
Select a background color. |