
Configuring logging and analytics NEW
FortiAnalyzer or Cloud Logging is a required component for the Security Fabric. Either FortiAnalyzer, FortiAnalyzer Cloud, or FortiGate Cloud can be used to met this requirement. These settings are configured on the Logging & Analytics card on the Security Fabric > Fabric Connectors page. If there are multiple services enrolled on the FortiGate, the preference is: FortiAnalyzer Cloud logging, FortiAnalyzer logging, then FortiGate Cloud logging.
The following topics provide more information about configuring the logging and analytics connector:
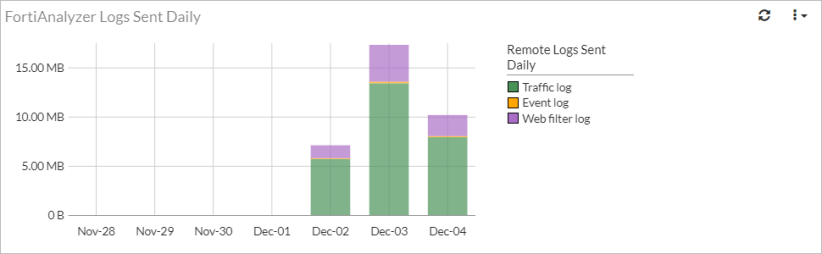
Logs Sent daily chart for remote logging sources
The Logs Sent widget displays a chart for a select remote logging source (FortiAnalyzer, FortiGate Cloud, and FortiAnalyzer Cloud). Once configured, the same data is available on the FortiAnalyzer and Cloud Logging tabs of the Logging & Analytics card.
To add the Logs Sent widget:
-
Go to Dashboard > Status and click Add Widget.
-
In the Resource Usage section, click the + beside Logs Sent.
-
Select a Logging Source (FortiAnalyzer, FortiGate Cloud, or FortiAnalyzer Cloud). FortiAnalyzer is used in this example.
-
Click Add Widget and click Close. The FortiAnalyzer Logs Sent Daily widget is displayed in the dashboard.
To view the chart on the Logging & Analytics card:
-
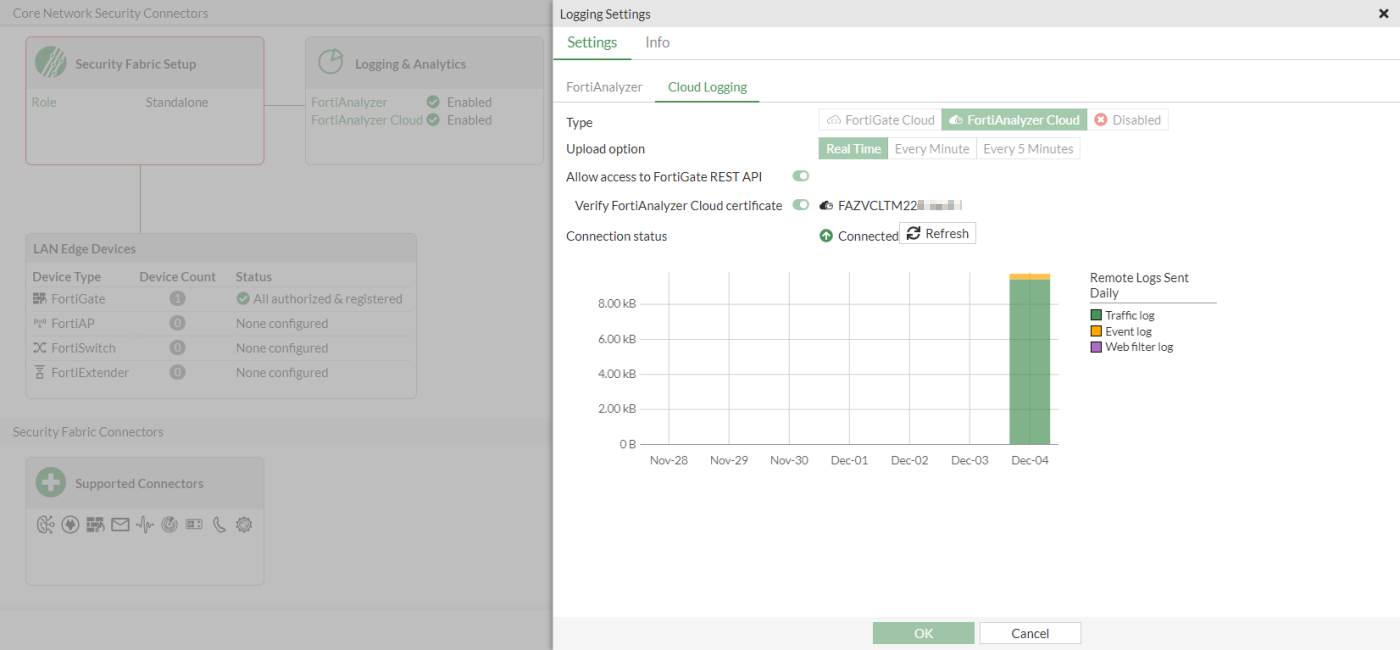
Go to Security Fabric > Fabric Connectors and double-click the Logging & Analytics card.
The Logging Settings pane is displayed.
-
In the Settings tab, click either FortiAnalyzer or Cloud Logging to view the Remote Logs Sent Daily chart. FortiAnalyzer Cloud is used in this example.
-
Click OK to close the pane.