
Investigation View
The Investigation View is accessible in the Event Analysis tab using the Investigation button (![]() ) when you select an incident in the Incidents tab. It helps understand the flow of activity events during Threat Hunting with a dynamic and interactive graphical view of the activity events details: source, action and target.
) when you select an incident in the Incidents tab. It helps understand the flow of activity events during Threat Hunting with a dynamic and interactive graphical view of the activity events details: source, action and target.
The graphical view provides the ability to add more activity events to the graph and show the relationship and timeline of the occurrence of those activities, such as the following:
-
All actions performed by a given process
-
All files the process has created or updated
-
All IPs the process has initiated communication with
It also allows you to interactively view a chain of activity events in the following ways:
-
Browse between the various processes involved in the chain
-
See all activity events related to one node in the Security Event graph
-
Filter activity events table to include or exclude a specific value
-
Switch and see the graph chain on the other involved endpoints while analyzing security event on one device
You can also perform certain actions, such as:
-
Retrieve or remediate files
-
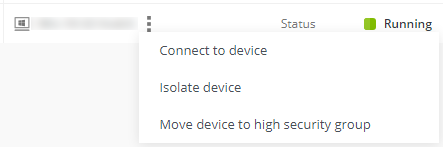
Connect to a device or isolate a device
-
Move a device to high security group
-
See the graph chain on the other involved endpoints while analyzing security event on one device
|
|
|
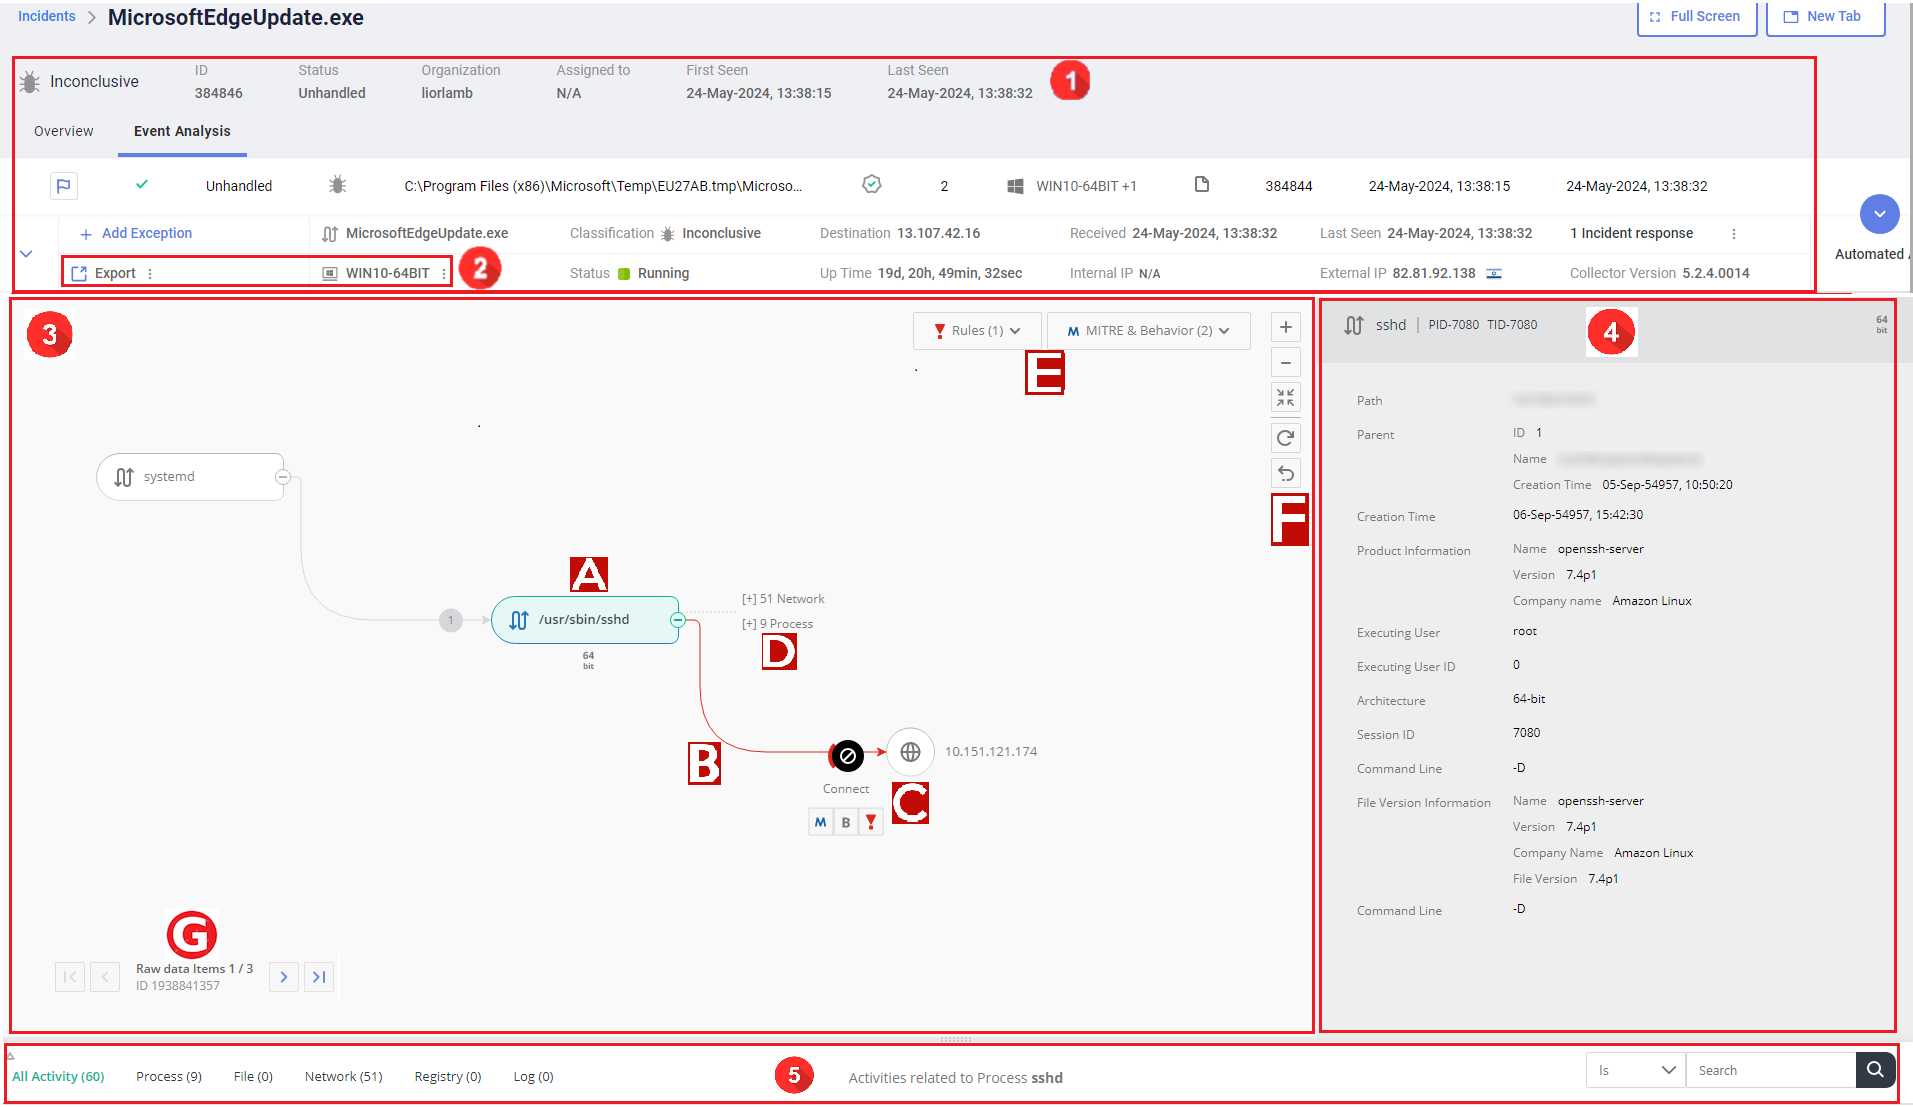
The following figure illustrates the various components of an Investigation View window launched from the Incidents view.
|
|
Compared with the investigation view window launched from the Details Pane under Threat Hunting, this view includes the following additional functionality:
|
|
Component |
Description |
||||||||||||||||
|---|---|---|---|---|---|---|---|---|---|---|---|---|---|---|---|---|---|
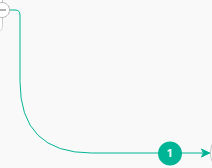
| 1 |
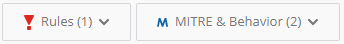
General details about the event, such as event ID, process name, classification, IP address, and incident responses. |
||||||||||||||||
| 2 |
|
||||||||||||||||
| 3 |
|
||||||||||||||||
| 4 |
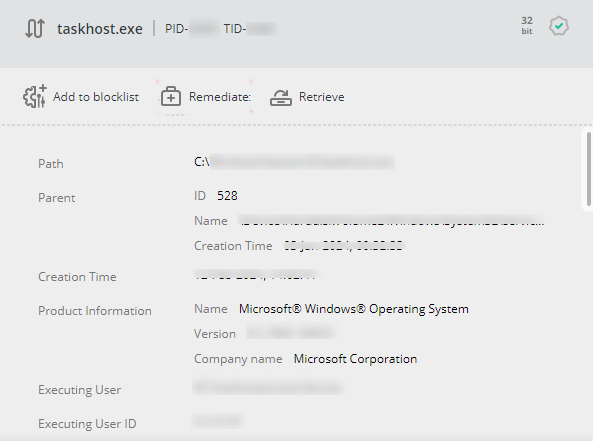
Details pane for the selected node, edge, or leaf where you can view details of the activity, action, or target, and perform common actions on a node or leaf, such as retrieving a file, remediating devices upon malware detection, or adding an application to the Application Control policy blocklist. The actions can also be performed by right-clicking a node or leaf and selecting the option from the menu.
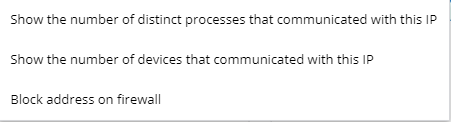
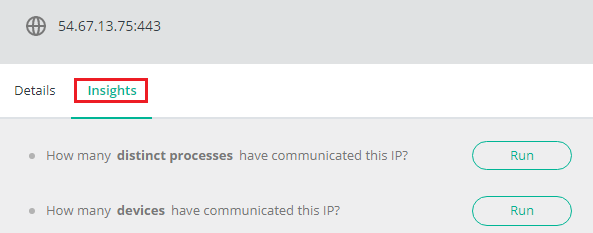
For specific leaf types, this pane also includes an Insights tab which allows you to run queries to retrieve analytics data, such as the number of communicating processes or devices of a certain IP. The Insights options are also available from the right-click menu of those leaf types.
|
||||||||||||||||
| 5 |
|
||||||||||||||||
 ) to save files for sharing or record reasons:
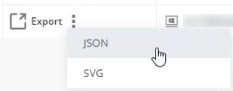
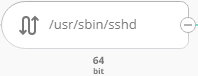
 ) or Expand (
 ) icon in the right of a node icon to show or hide all the downstream nodes, edges, and leaves.
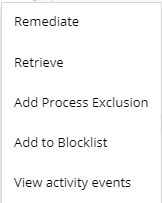
 ).
).

 ) or Collapse (
 ) icon near a leaf hint to show or hide the node or leaf list of that type.
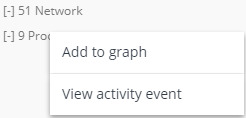
 ), Zoom Out (
 ), and Zoom To Fit (
 ) buttons to adjust the graph window size.
 ) button to restore the graph to the default view.
 ) button to cancel an operation.
 ).
). ).
). ).
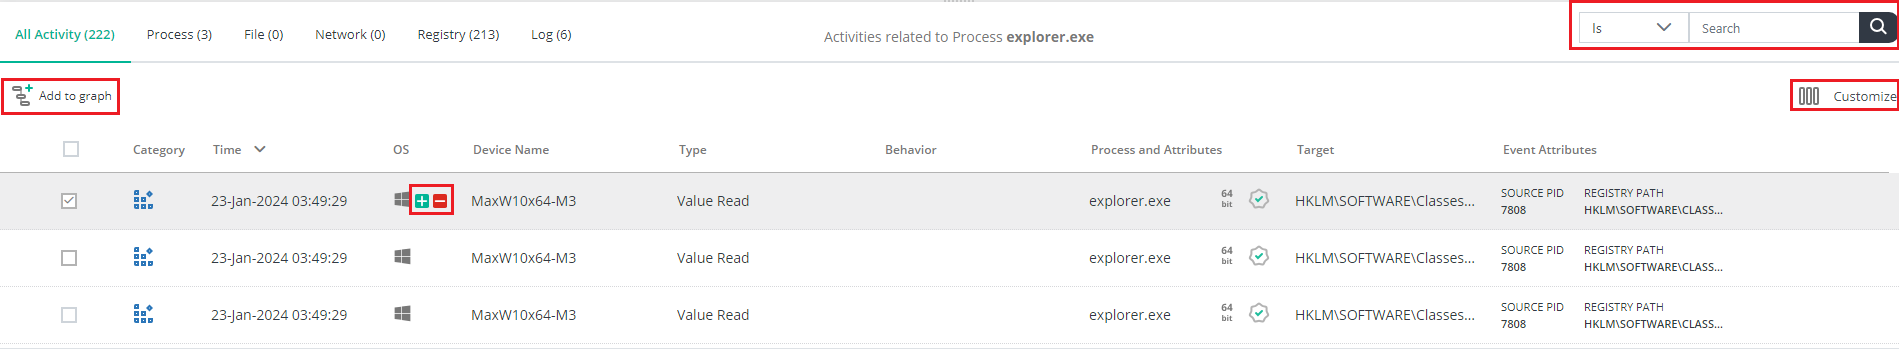
). ) and red minus (
 ) icons that appear when you hover over the value. Multiple filters are supported. To delete a filter, click the cancel icon that appear when you hover over the filter on the top-left of the table.