


FortiView monitors for FortiMail 7.0.3
Many new dashboards are available to provide detailed summary of the mail, threat, and IP session statistics
To view FortiMail widgets in FortiView:
- Go to FortiView > Monitors > FortiMail.
- Click Add Widget to add a FortiMail widget to the dashboard.
The following FortiMail widgets are available:-
Statistics History: The statistics history from FortiMail that displays the summary of total messages and spam in the selected time period. Place your mouse over a line in the chart to view a tooltip which includes the total messages and total spam for the corresponding date and time.

-
Top Sender by Categories: The top email, virus, and spam senders in the selected time period. Place your mouse over a bar in the graph to view a tooltip which includes the sender, count, size, virus count, and spam count. This widget may be viewed by Count, Size, Virus Count, and Spam Count.

-
Top Recipient by Categories: The top email, virus, and spam recipients in the selected time period. Place your mouse over a bar in the graph to view a tooltip which includes the recipient, count, size, virus count, and spam count. This widget may be viewed by Count, Size, Virus Count, and Spam Count.

-
Threat Statistics: The summary of spam and virus mail in the selected time period. Place your mouse over a bar in the graph to view a tooltip which includes the date/time, classifier, and count. This widget may be viewed by Count and Size. This widget can be also be displayed as a donut chart which includes charts for total mail, virus mail, and spam mail.


-
Mail Statistics: The summary of email messages where the FortiMail detected viruses, spam, or neither in the selected time period. Place your mouse over a bar in the graph to view a tooltip which includes the date/time, classifier, and count. This widget may be viewed by Count, Size, Scan Speed, and Transfer Speed.

-
Outbreak Statistics (FortiSandbox): The summary of the number of email messages that the FortiSandbox unit is scanning in the selected time period. Email messages are tracked as either clean, containing a malicious file, or containing a malicious URL. Place your mouse over a bar in the graph to view a tooltip which includes the date/time, clean, malicious file, and malicious URL. This widget requires a FortiSandbox.

-
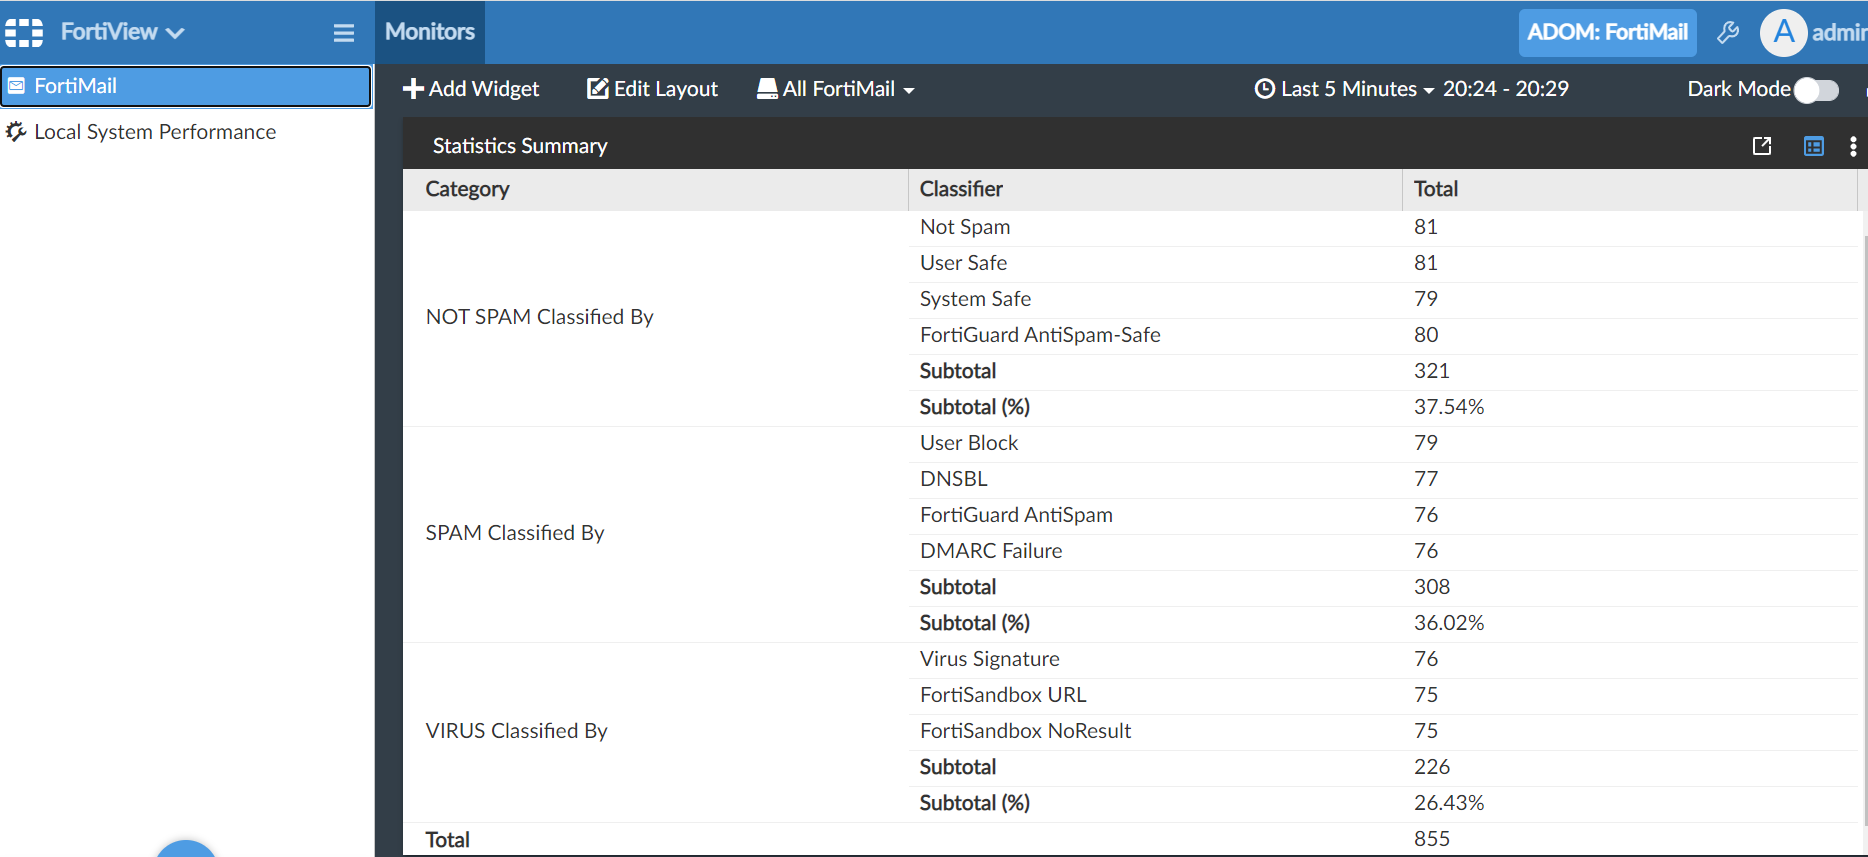
Statistics Summary: The summary of spam, viruses, and not spam in the selected time period, including the classifier details per category, the corresponding total number of every classifier, the subtotal number, the subtotal percentage of every category, and the total number of all emails.
-
Statistics History: The statistics history from FortiMail that displays the summary of total messages and spam in the selected time period. Place your mouse over a line in the chart to view a tooltip which includes the total messages and total spam for the corresponding date and time.