
Monitoring Widgets
The AI ARRP window consists of four primary widgets designed to analyze the impact and reasons behind channel changes and radio health.
Note: To add the required widget to the dashboard, click Add Widget and from the Wireless > AI ARRP section, select a widget and click +.
Impacted Radio Forecast
This chart visualizes the difference between the observed (actual) and the forecast count of problematic radios by plotting the number of impacted radios against a specific time period.
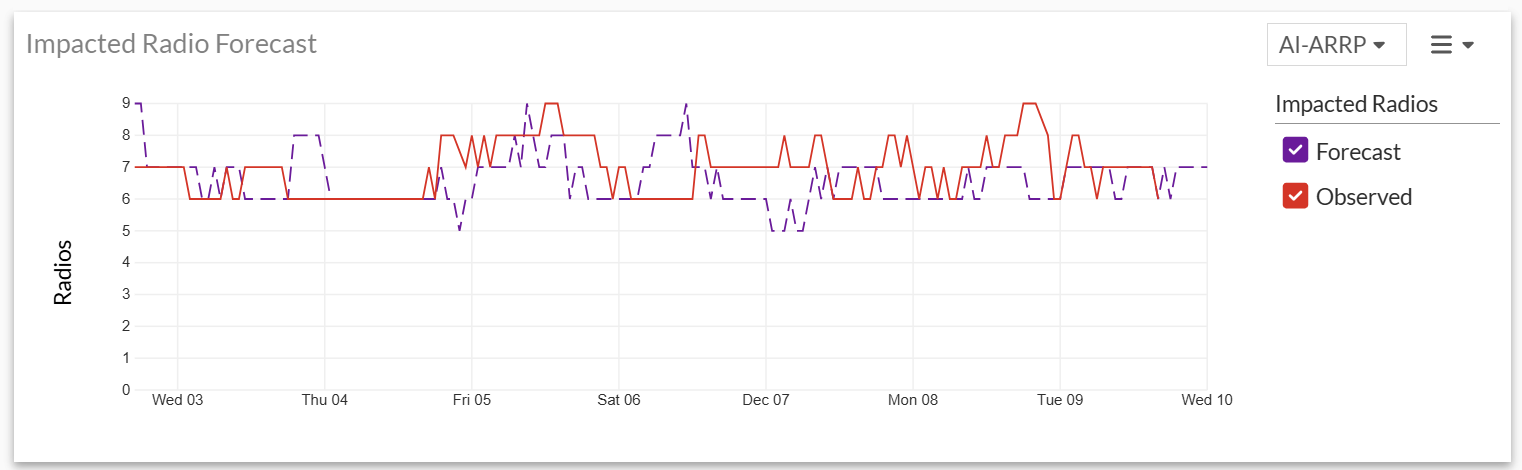
The chart displays two key metrics:
-
Observed: This line represents the real-time count of impacted radios that the system currently identifies as unhealthy or impacted.
-
Forecast: This line shows the predicted count of impacted radios that the AI-ARRP model estimates will be impacted.
You can filter the displayed radio data using the drop-down menu to view specific management types:
-
AI-ARRP: Displays details only for radios where the AI-ARRP feature is enabled.
-
Non-AI-ARRP: Includes radios where traditional DARRP is either enabled or disabled.
-
All: Shows data covering both AI-ARRP managed radios and Non-AI-ARRP radios.
Hover over a data point on the chart to view more details.
Clicking on a data point on the chart opens the details pane. See Detailed Analysis and Optimization.
Radio Health Summary
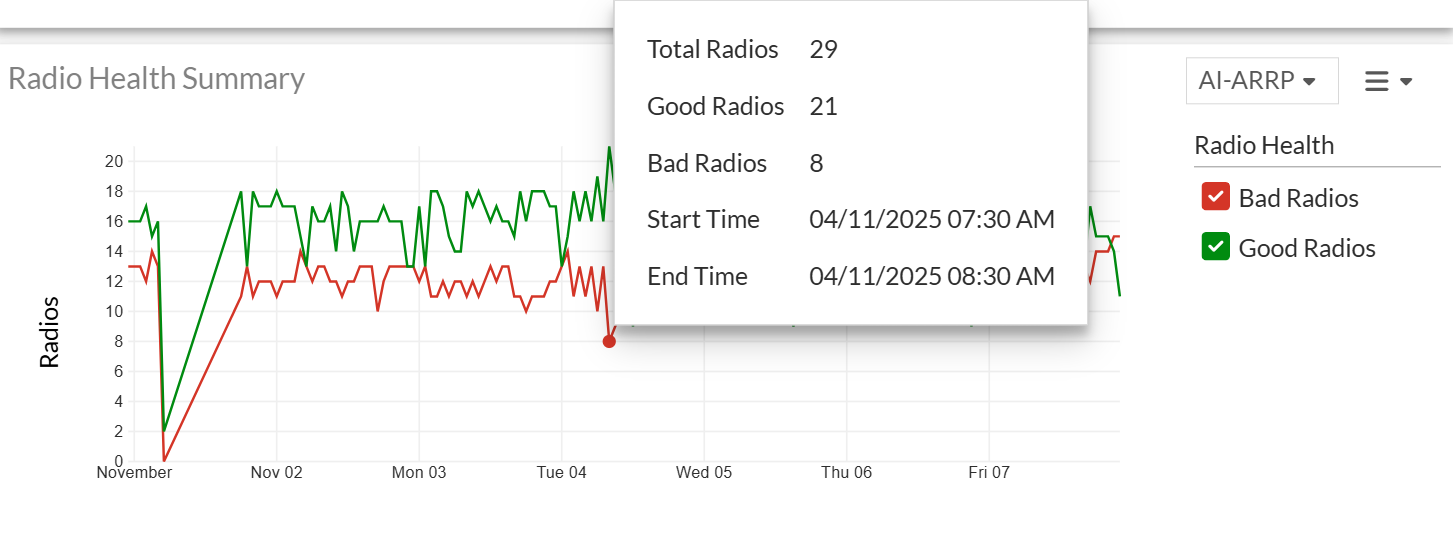
The Radio Health Summary chart shows the overall status of all AP radios by comparing how many radios are operating on good channels versus bad channels over time. Radios on good-performing channels are counted as Good Radios, while those running on poor-performing channels are counted as Bad Radios.
You can filter the displayed radio data using the drop-down menu to view specific management types:
-
AI-ARRP: Displays details only for radios where the AI-ARRP feature is enabled.
-
Non-AI-ARRP: Includes radios where traditional DARRP is either enabled or disabled.
Hover over a data point on the chart to view more details.
Clicking on a data point on the chart opens the details pane. See Detailed Analysis and Optimization.
Channel Change Events
This chart provides detailed visibility into all channel change events triggered by the radio provisioning system. It captures channel changes initiated through both AI-ARRP from FortiAIOPs and DARRP from Fortigate.
When the AI-ARRP filter is applied, the chart shows all channel changes recommended by AI-ARRP.
When the Non-AI-ARRP filter is applied, it displays channel changes triggered by DARRP.
The chart shows how many times AP radios across the network switched their operating channel within the selected time period.
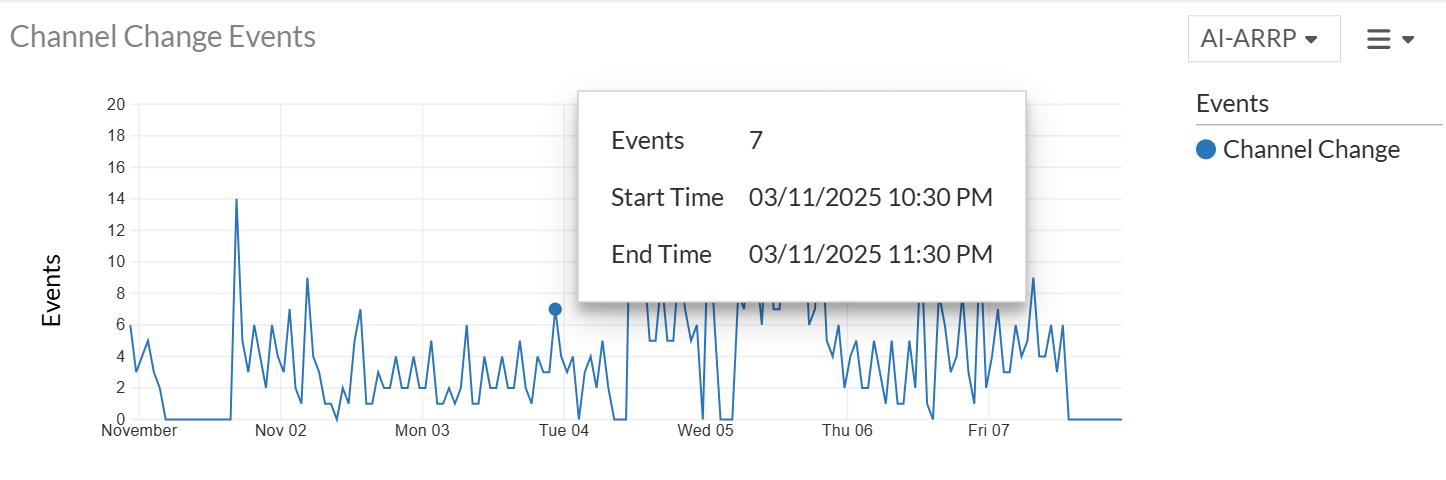
Hover over a data point on the chart to view more details.
Clicking on a data point on the chart opens the Details pane.
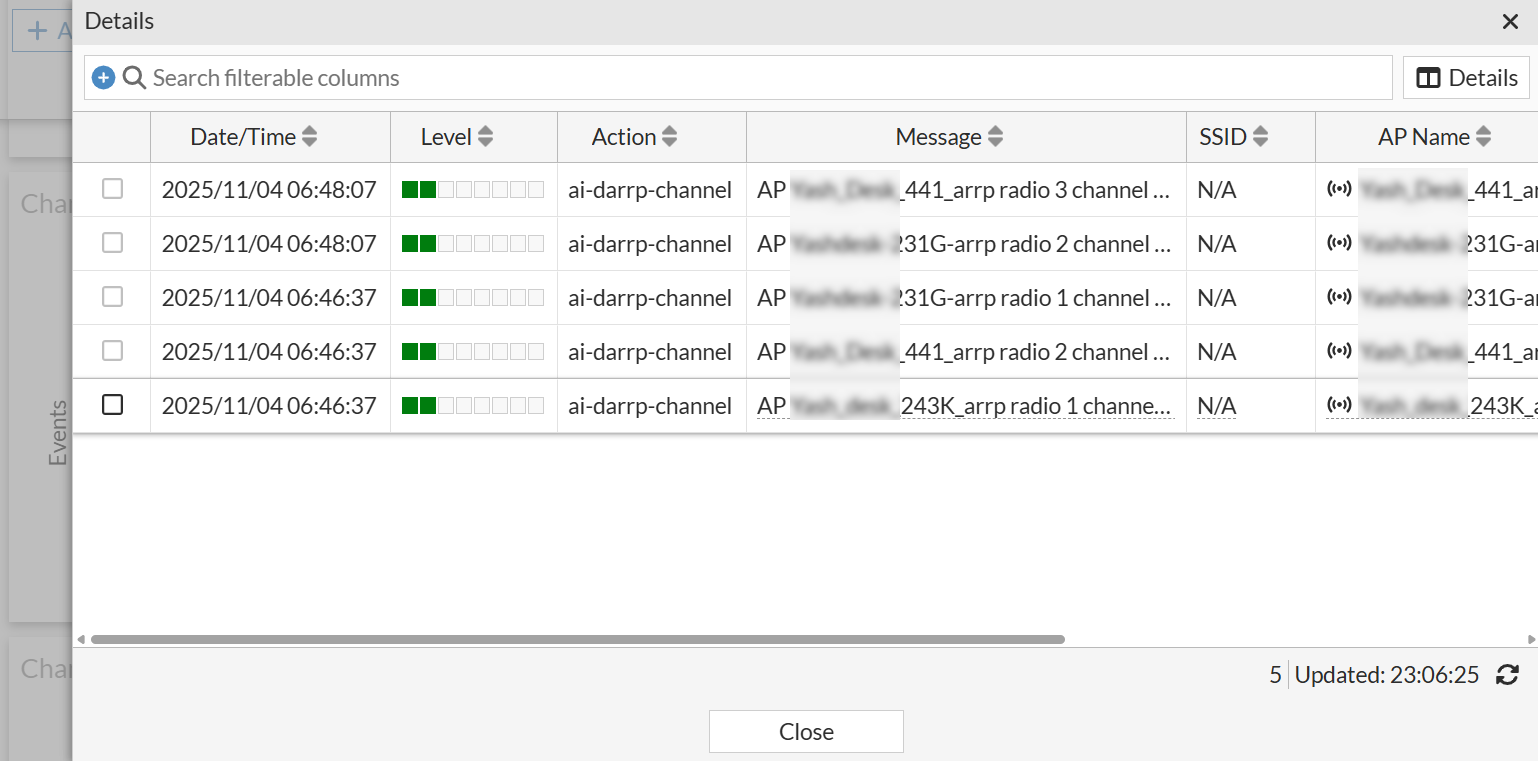
The table in the Details pane provide details such as Date/Time, Level, Action, Message, SSID, AP Name, Log ID, FortiGate Serial Number, and Channel.
Select an event and click ![]() icon to view further details.
icon to view further details.
![]()
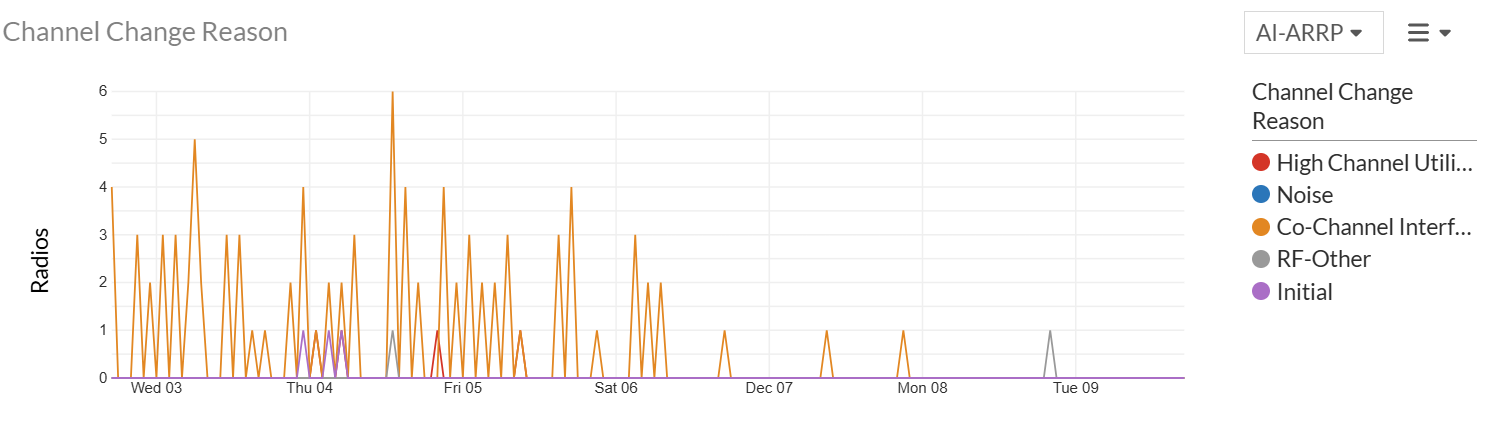
Channel Change Reason
This widget provides a detailed breakdown of the factors that prompted AI-ARRP to recommend a channel change, highlighting the key conditions that affected the health of the current operating channel. The reasons reported include:
-
High Channel Utilization
-
Noise
-
Co-channel Interference (neighboring APs detected on overlapping channels)
-
RF-Other (such as Spectral RSSI)
-
Initial (channel change applied based on FortiGate results)
When the Non-AI-ARRP filter is applied, the widget displays the reason as DARRP, indicating that the channel change was recommended by FortiOS DARRP.
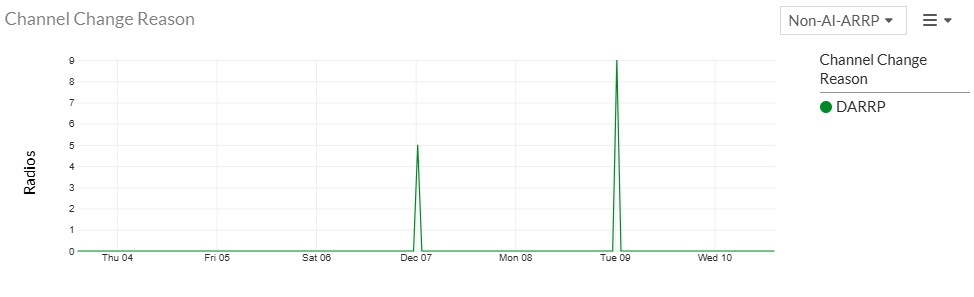
Hover over a data point on the chart to view more details.
Clicking on a data point on the chart opens the details pane. See Detailed Analysis and Optimization.