Detailed Analysis and Optimization
Clicking on a data point in the Impacted Radio Forecast or Radio Health Summary or Channel Change Reason charts opens a pane for detailed analysis and action.
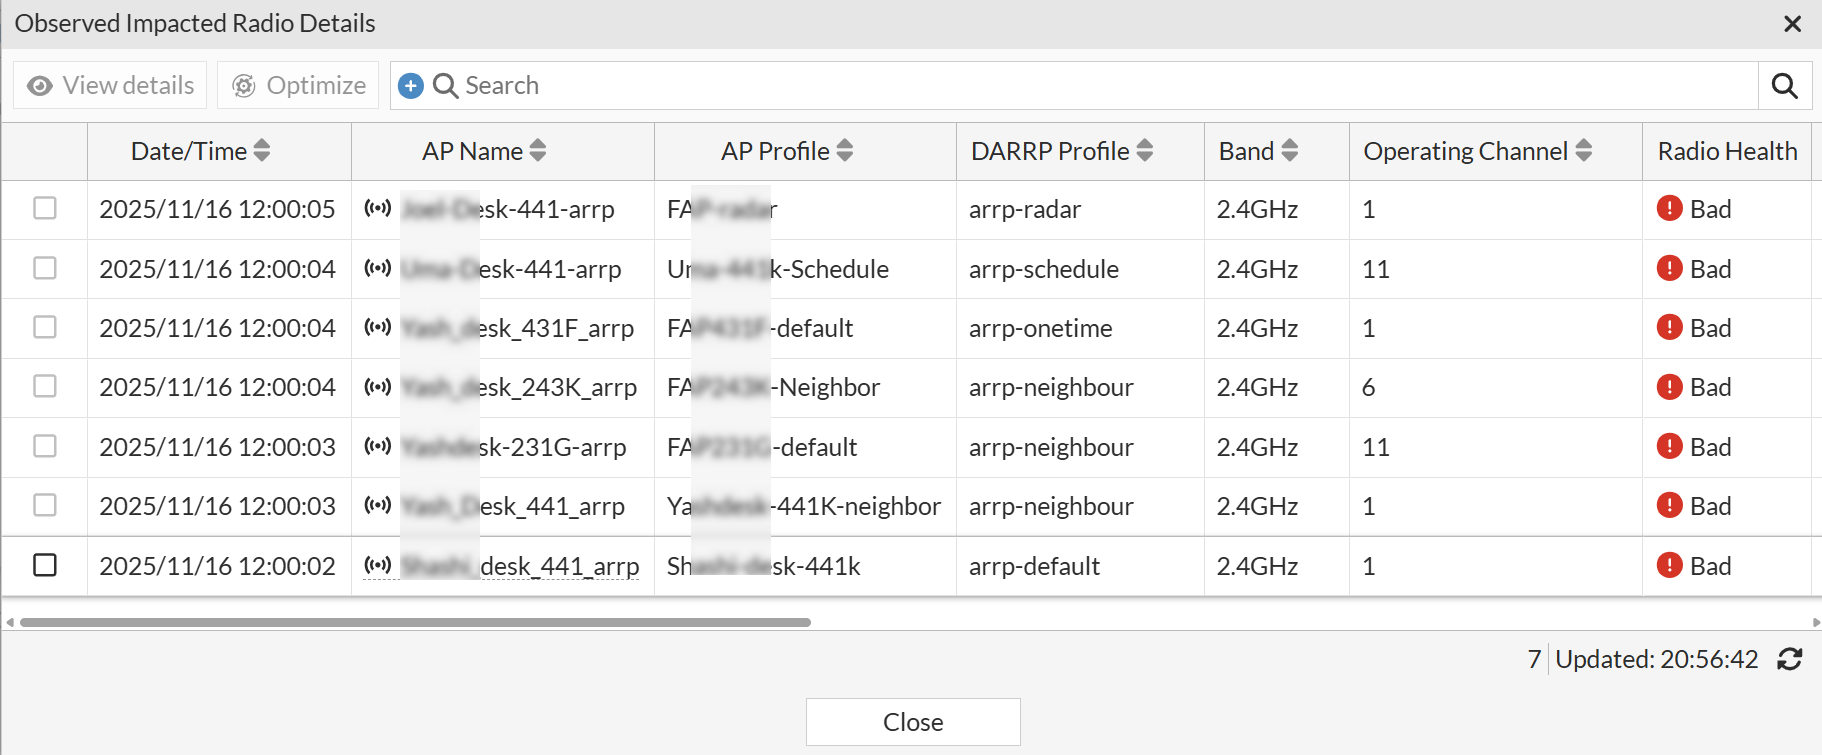
The table displays information such as Date/Time, AP Name, AP Profile, DARRP Profile, Band, Operating Channel, Radio Health, Radio Health Summary, Radio ID, Channel Change Reason, FortiGate Name, AP Serial Number, FortiGate Serial Number, and Last Channel Change.
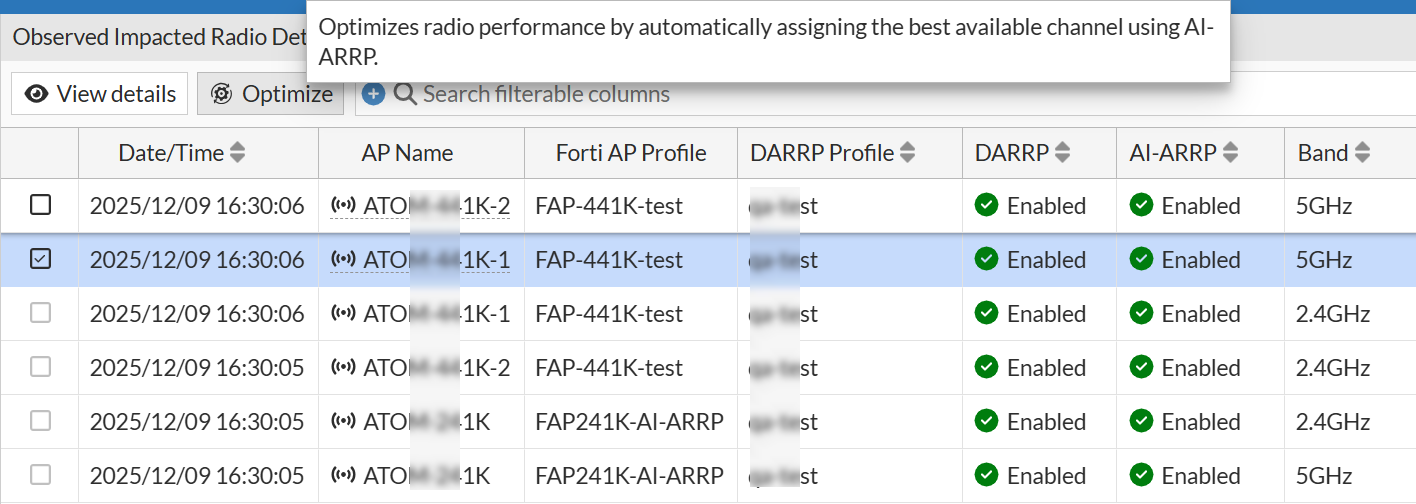
Optimize
Select an AP radio and click Optimize to manually trigger an immediate channel planning on that radio. This action evaluates the current RF environment and recommends the most optimal operating channel. Unlike the scheduled AI-ARRP runs, this channel-planning operation occurs instantly and may impact connected clients if performed during business hours.
Note: Optimize can be performed only on radios impacted in last 1 hour.
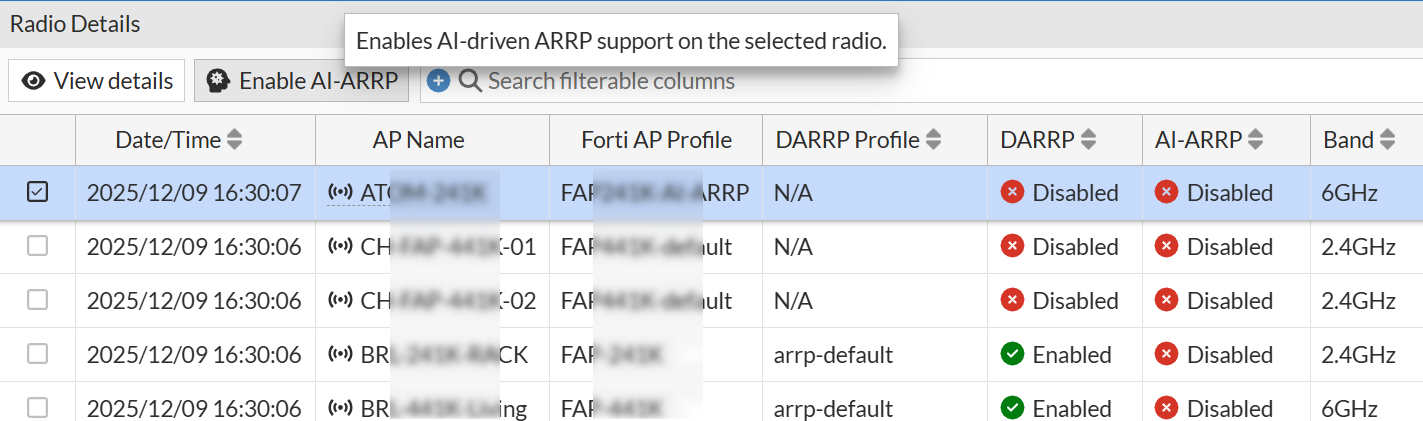
Enable AI-ARRP
You can enable AI-ARRP from FortiAIOps for Non AI-ARRP radios. To enable, select the Non AI-ARRP radios impacted in the last 1 hour and click Enable AI-ARRP.
View Details
Select and AP and click View Details to open the dedicated Details pane for the selected radio.
Note: Similar insights are available for individual Access Points on a per-radio basis by navigating to Wireless > Access Points. Select the desired AP, click View Details, and then go to the Radio Insights tab and the AI-ARRP sub-tab.
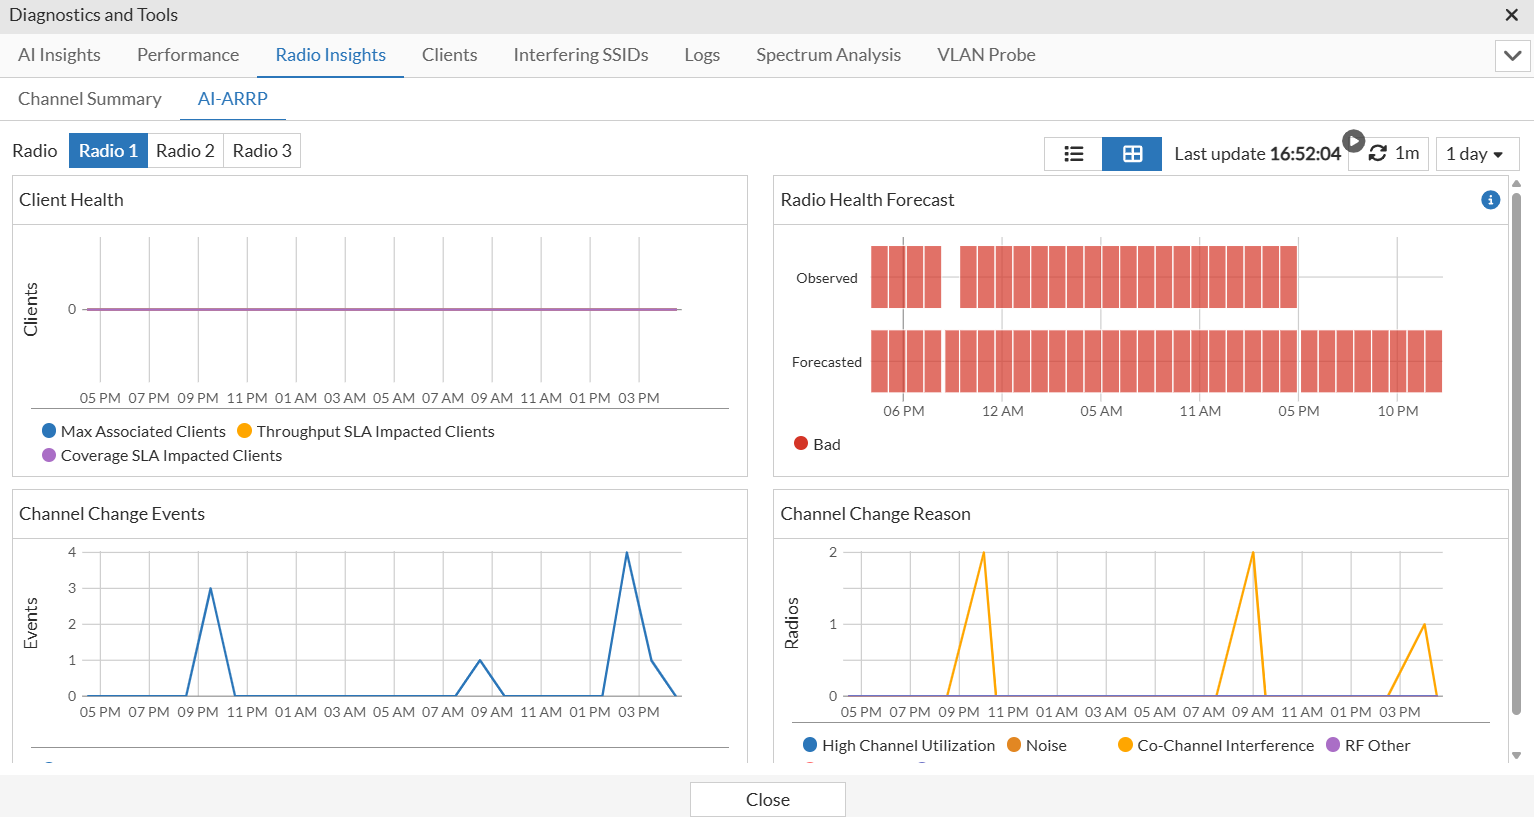
The following charts are displayed:
Client Health
This chart tracks the following client-related issues over time.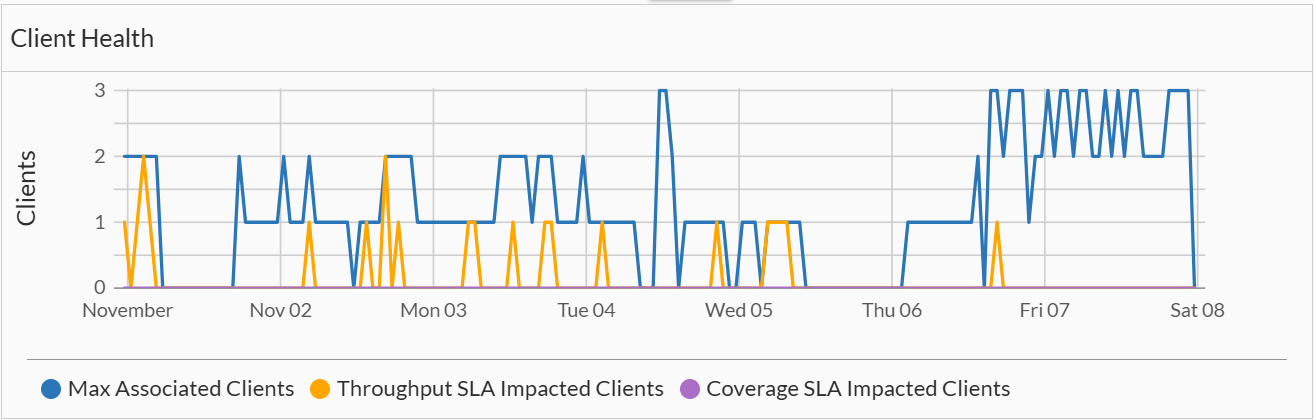
-
Max Associated Clients: Shows the maximum number of clients associated with this specific radio.
-
Throughput SLA Impacted Clients: Tracks clients whose throughput is falling below the configured Service Level Agreement (SLA).
-
Coverage SLA Impacted Clients: Tracks clients experiencing poor coverage.
Radio Health Forecast
This bar chart provides a visualization of the radio health over the monitored period.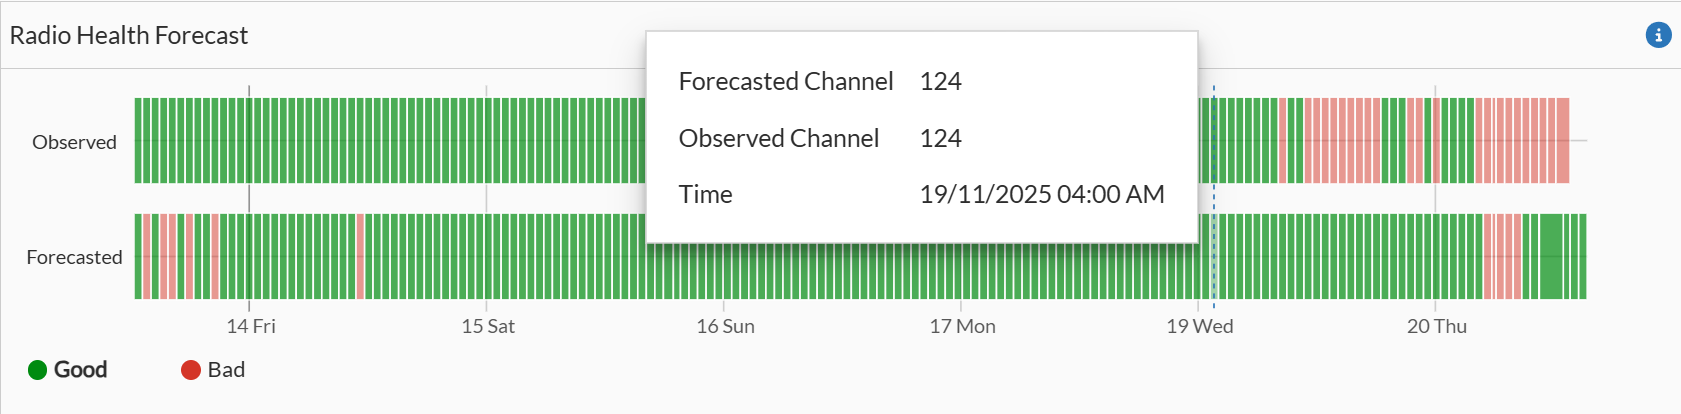
-
Observed: Shows the actual periods when the radio's health was good or bad on operating channel. Red bars indicate periods when the radio’s channel health was bad, while green bars represent periods when the radio was operating with good channel
-
Forecast: Shows the periods when the AI-ARRP model predicted that the radio health on channel would be impacted. This helps evaluate the accuracy of the AI prediction against the observed reality.
Channel Change Events
This chart displays a time-series graph showing the number of channel change events that occurred for this specific radio.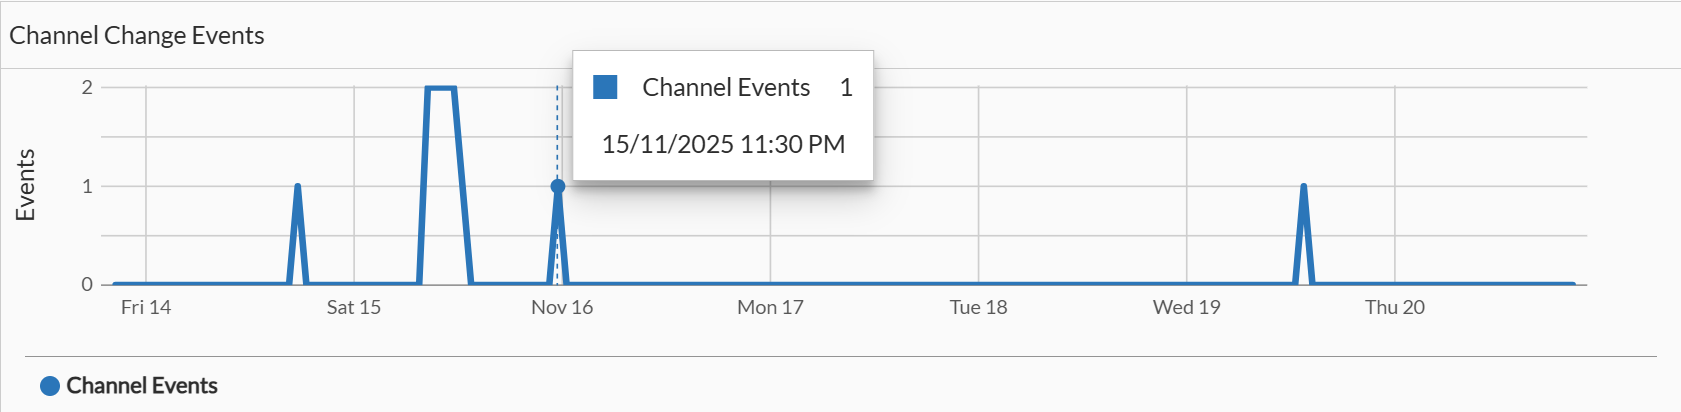
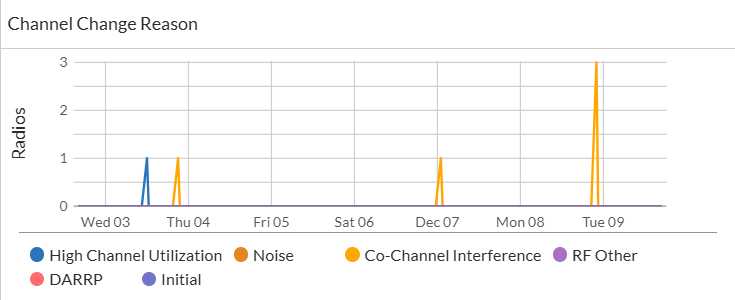
Channel Change Reason
This chart categorizes why the channel change events took place. It identifies the specific trigger for the channel switches such as High Channel Utilization, Noise, Co-Channel Interference, RF Other, or DARRP.