Summary
This dashboard provides visual summary of key system information, network elements, and resource usage.
The following charts are available:
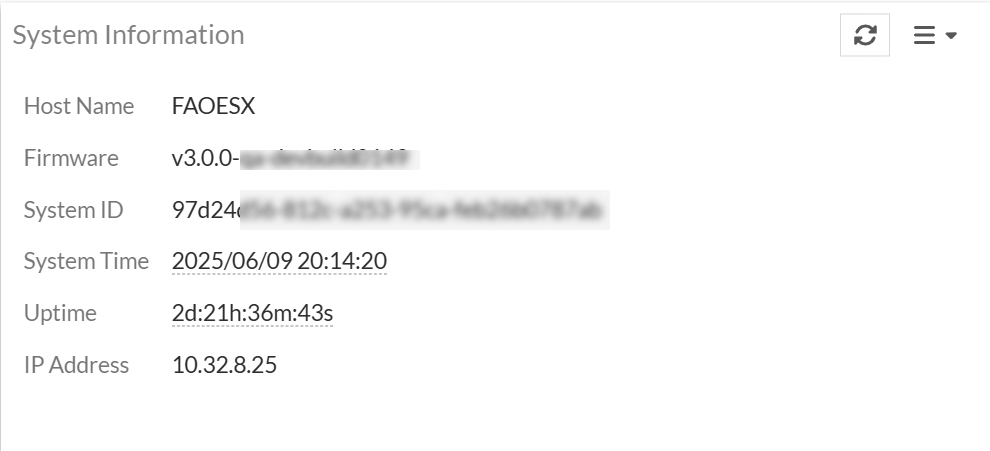
System Information
This widget provides generic information about the FortiAIOps such as the host name, firmware version, system ID, current system time, uptime, and the IP address.
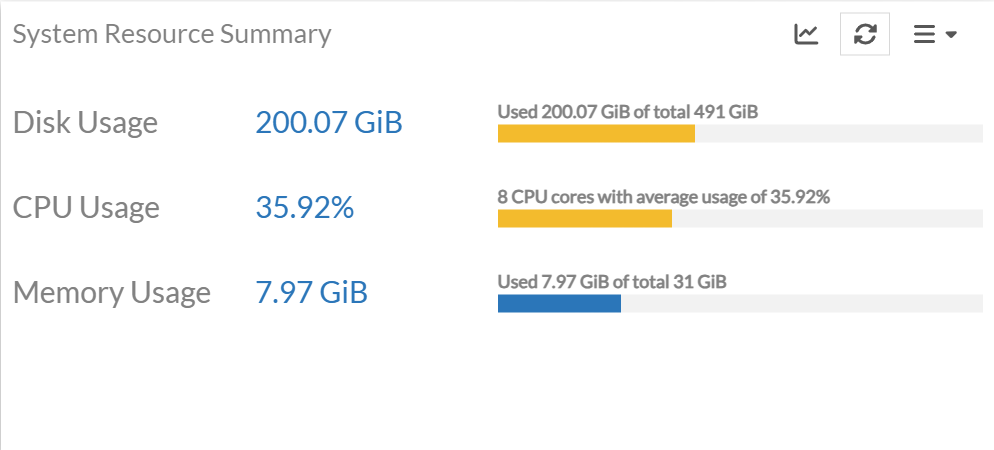
System Resource Summary
This widget provides an overview of the current system resource usage for FortiAIOps. The statistics include the total available and used disk space (HDD and SSD), the number of CPU cores used and the average usage, and total available and used memory. Click on the trends icon to view the resource usage summary; filter data based on the selected duration or customized time slot. You can select a time window or define a Custom range. The custom range allows the selection of a minimum of 1 day and the maximum is the duration of log retention configured in System > Settings.The minimum, maximum, and average values are displayed when a time interval of more than 6 hours is selected.
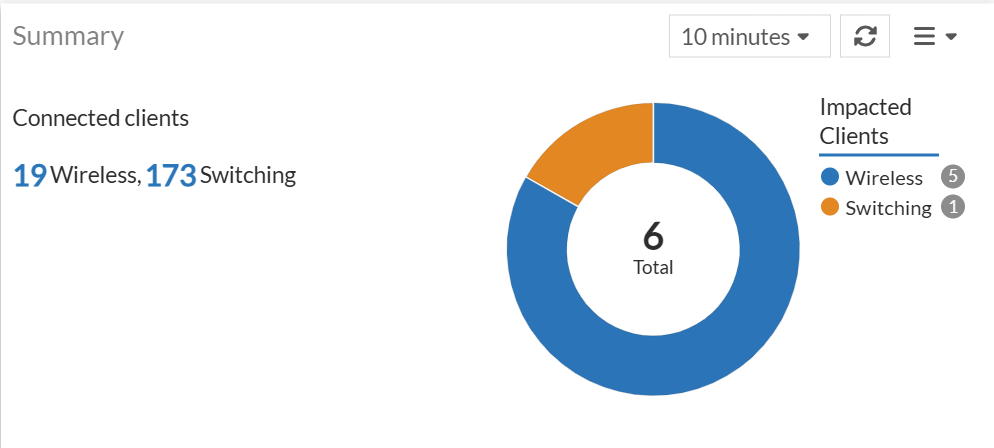
Summary
This chart displays details of the various devices in your network that are associated with impacted clients, that include the wireless, switching, and WAN clients. For more information, see Impacted Devices.
Acknowledged Events
The Acknowledged Events chart offers a quick overview of acknowledged events. The chart shows the total number of acknowledged events and categorizes them by type within a specific timeframe.
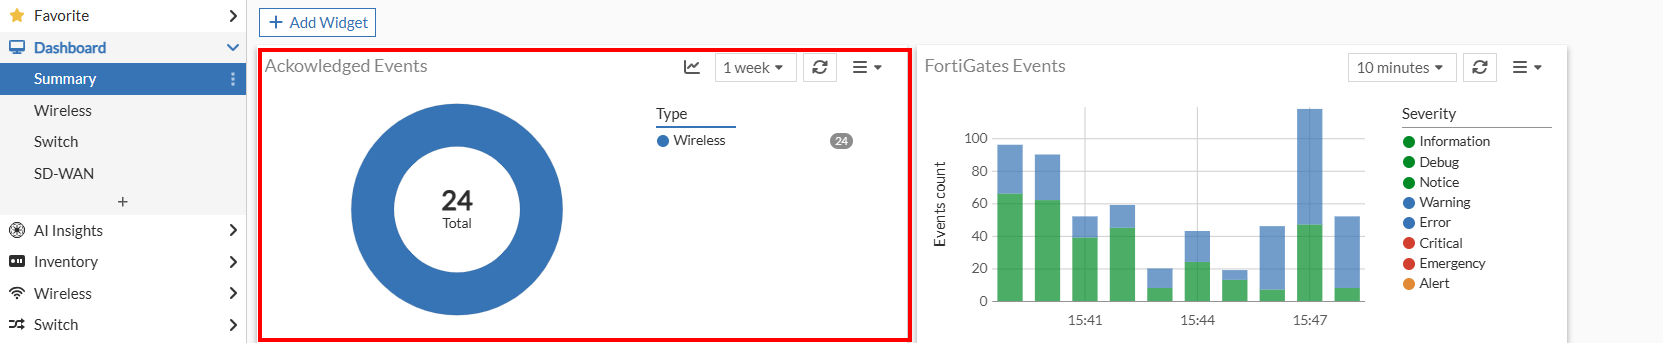
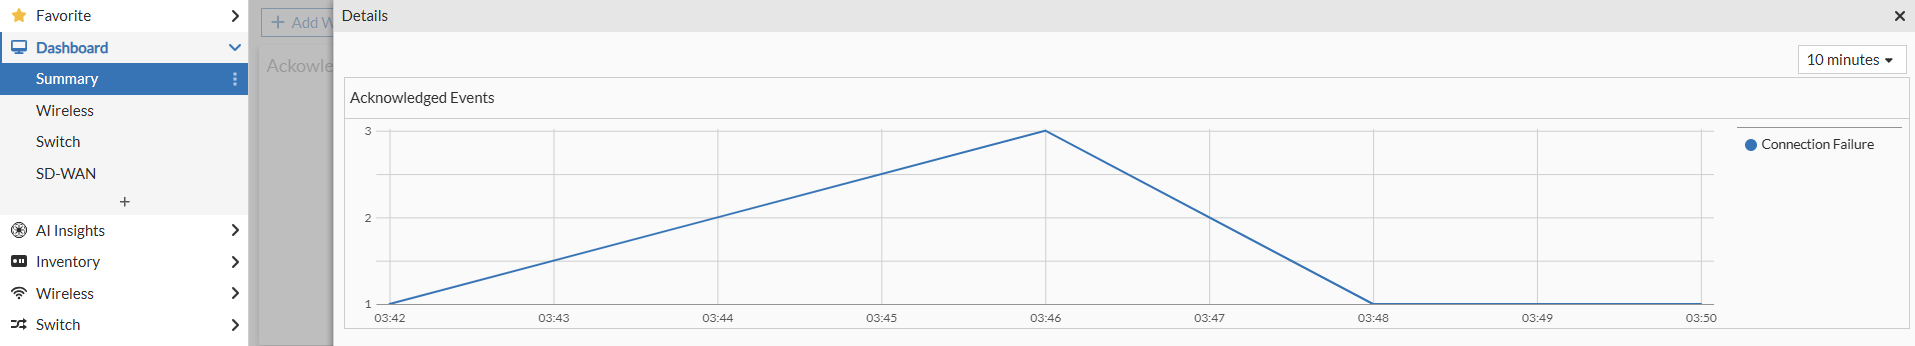
Click the icon to see a line chart that breaks down the number of acknowledged events over a period for a specific SLA.
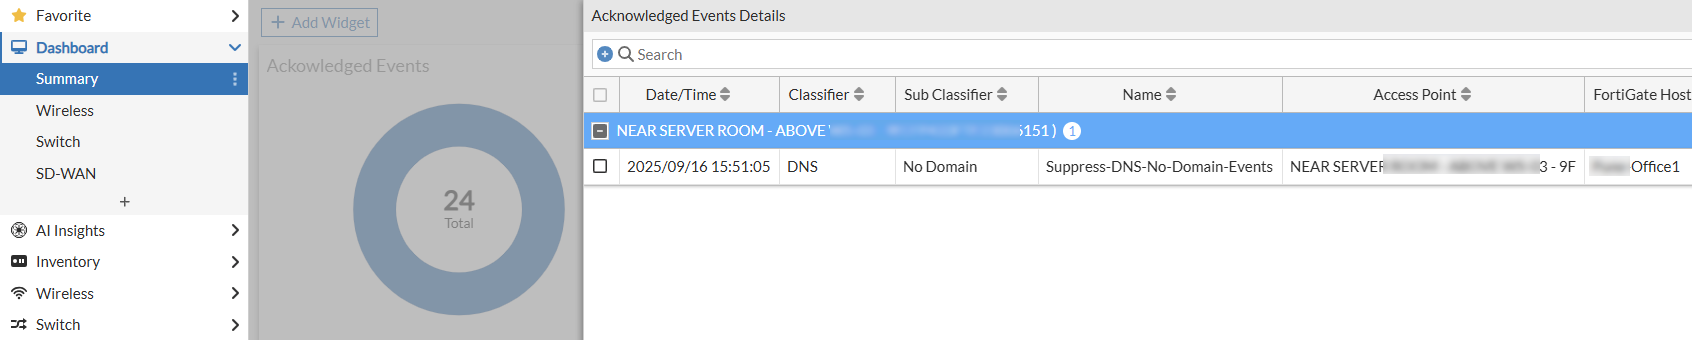
Click the chart itself to open the Acknowledged Events Details pane, which provides more in-depth information.
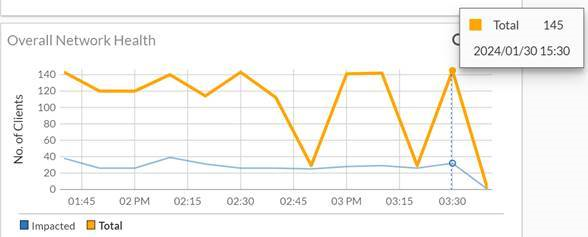
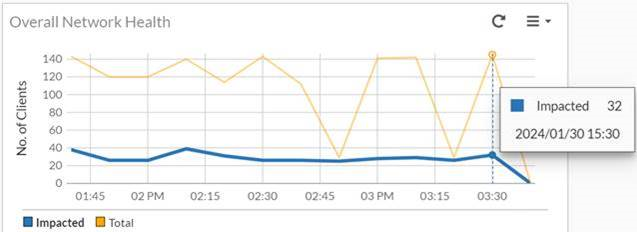
Overall Network Health
This panel displays the overall client count trends and health status of all wireless, switching, and WAN clients connected to your network, at specific intervals of 10 minutes. You can view the total number of clients in your network and the number of impacted clients at a given point in time.
Hover over the line to view the total number of clients and the
line to view the number of impacted clients. In this example, at 03.30 hours, a total of 145 clients were present in the network of which 32 clients are impacted.
Click on any given time interval for total clients to view the Connected Clients panel. The data displayed in tabular format in all the monitor dashboard pages is filterable based on columns, you can group data by a specific column or filter data for specific values.
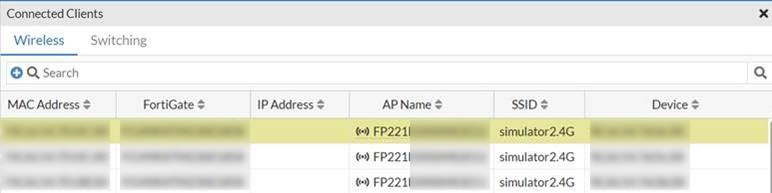
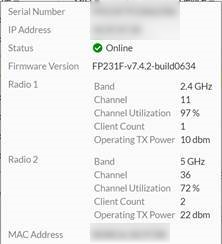
Click the AP Name to view the FortiAP details and the operational status of the radios.
Click on any given time interval for total clients to view the Overall Network Health panel. This page displays details of the various devices in your network that are associated with impacted clients. The number of devices are listed for each category, you can click on any of these or click on the respective section in the donut chart to view details. The data is displayed in the following three panels. Refer to Impacted Devices for more descriptions.
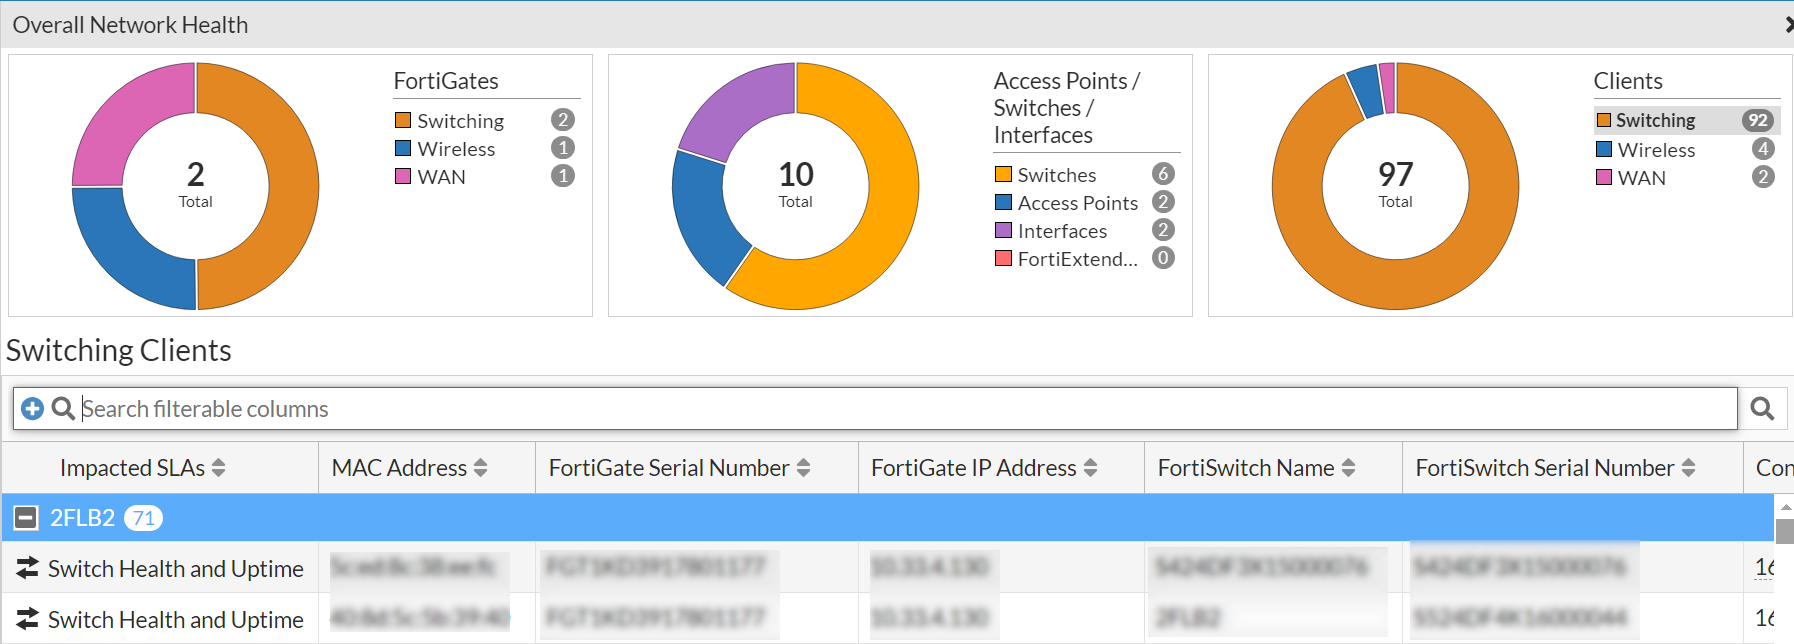
FortiGates - Displays the number of deployed FortiGate controllers with impacted wireless, switching, and WAN clients.
-
Access Points/ Switches/ Interfaces/FortiExtenders - Displays the number of devices, that is, APs, interfaces, FortiExtenders, and switches with impacted clients.
-
Clients - Displays the number of impacted clients for the wireless, switching, and WAN.
Click on the impacted SLA to view the device topology.
Top 5 Problematic Devices
This panel displays the 5 devices with the highest number of impacted clients. The devices displayed here can be FortiAPs, FortiSwitches, FortiExtenders, and/or interfaces. The device name and the number of associated clients that are impacted are displayed in descending order.
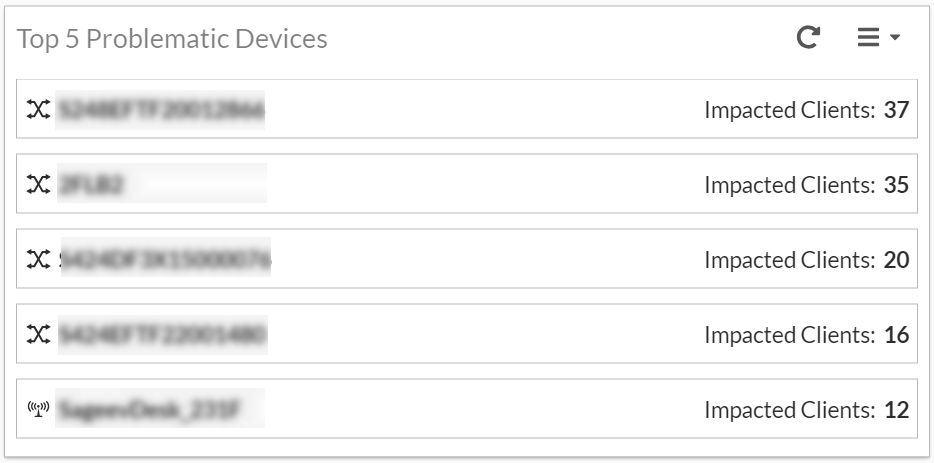
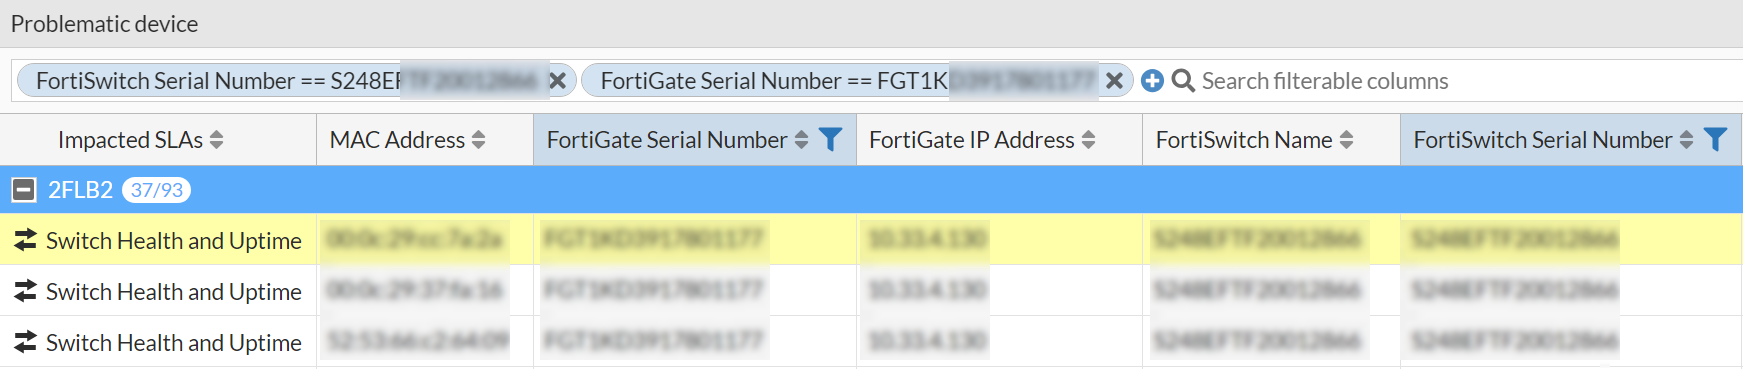
Click on the device name to view details.
Impacted Clients Trend
The Impacted Clients Trend panel displays data trends for the total number of impacted clients for switching, wireless, and WAN, over a period of time.
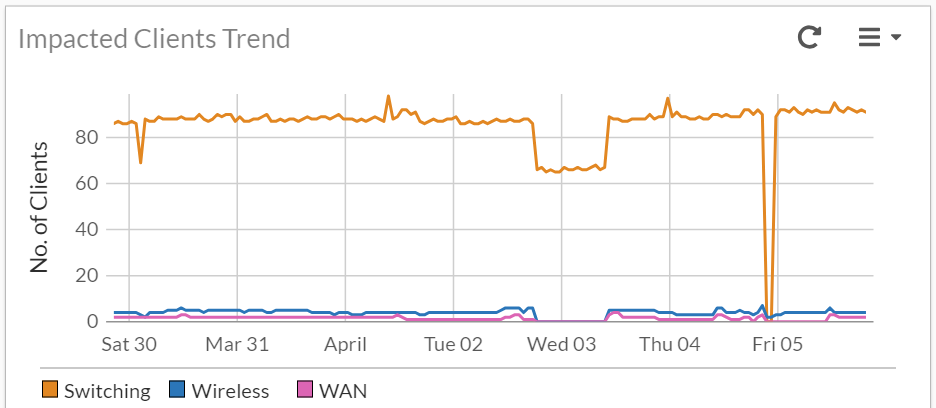
Click on any given time interval for the impacted clients to view the Impacted Clients page. This page displays details of the various devices in your network that are associated with impacted clients. The following image depicts an example of the impacted WAN clients.
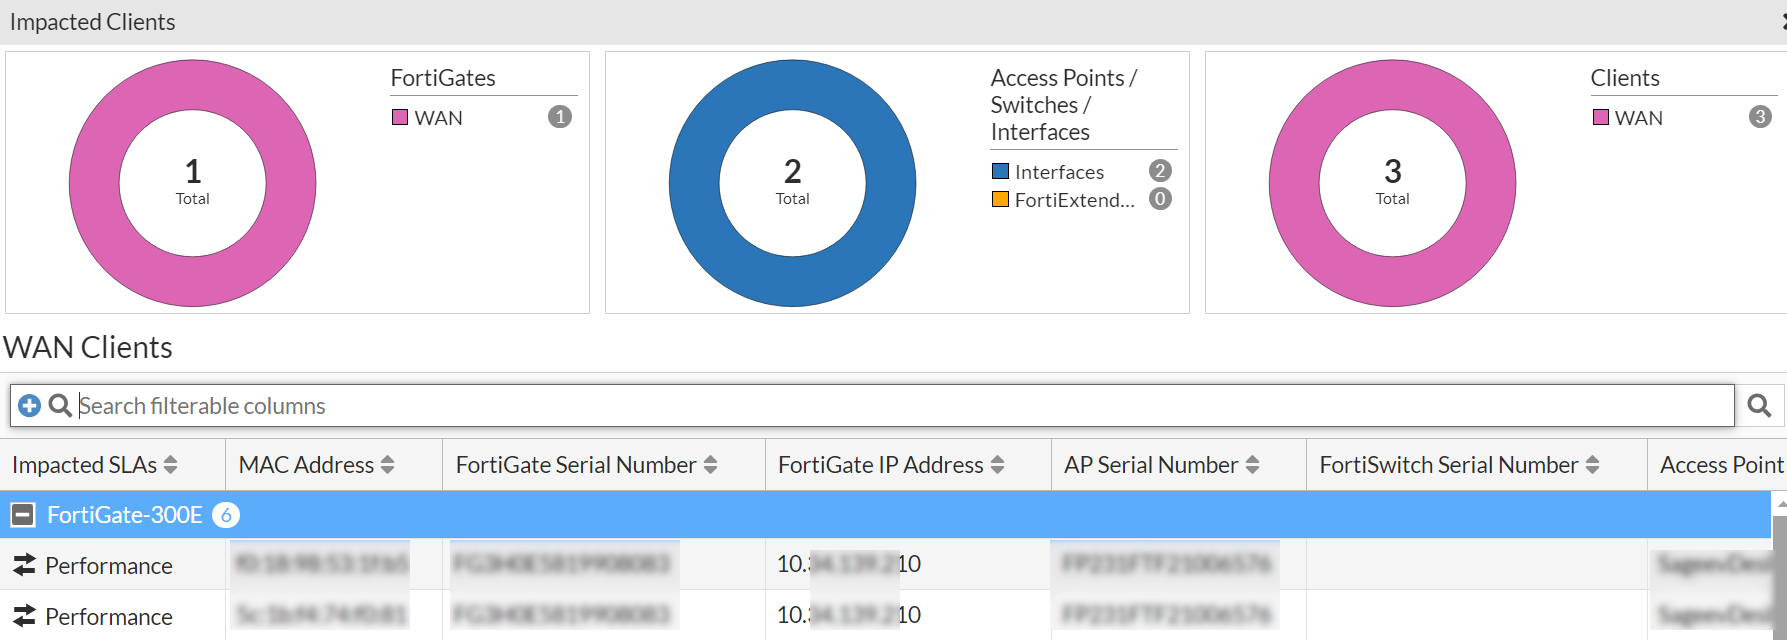
The data is displayed in the following three panels. For more information on the data and fields displayed on this page, see Impacted Devices.
-
FortiGates - Displays the number of deployed FortiGate controllers with impacted wireless, switching, and WAN clients.
-
Access Points/ Switches/ Interfaces/FortiExtenders - Displays the number of devices, that is, APs, interfaces, FortiExtenders, and switches with impacted clients.
-
Clients - Displays the number of impacted clients for the wireless, switching, and WAN.
FortiGates
Displays the total number of FortiGate controllers in your network and their status (Online/Offline). Click on the chart to view more details of the controllers. For more information, see Managing FortiGates.
FortiGate Events
Displays the FortiGate events at a given time and categorizes them based on the severity level as, Information, Debug, Notice, Warning, Error, Critical, Emergency, and Alert. You can select the period to view the data (10 or 30 minutes, 1 or 12 hours, or 1 day).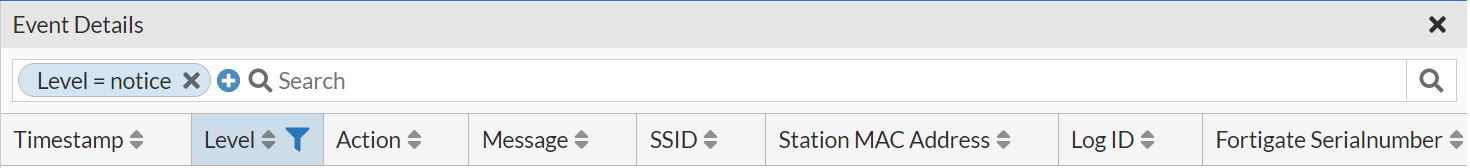
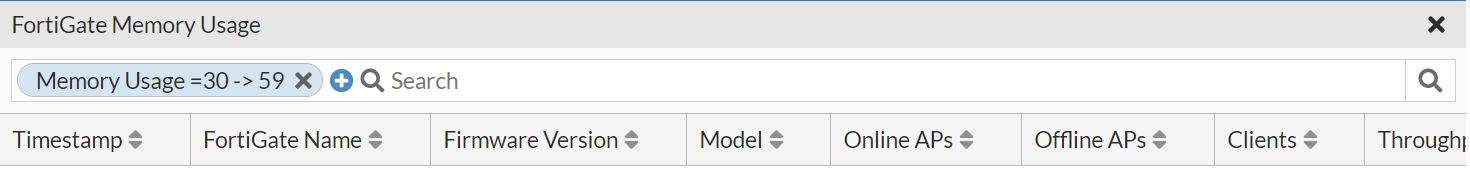
FortiGates CPU Usage and FortiGates Memory Usage
Displays the real-time FotiGate CPU and memory usage at a given time and categorizes it as Low, Medium, High, and Critical. You can select the period to view the resource usage (10 or 30 minutes, 1 or 12 hours, or 1 day). Click on the graph to view the details.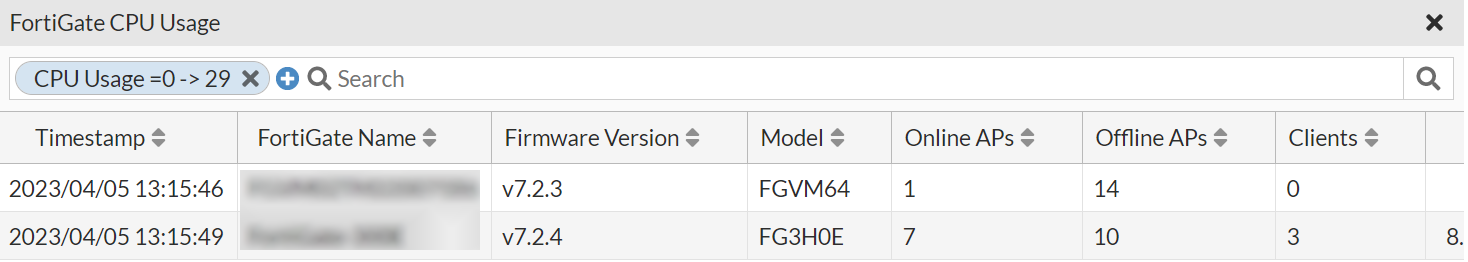
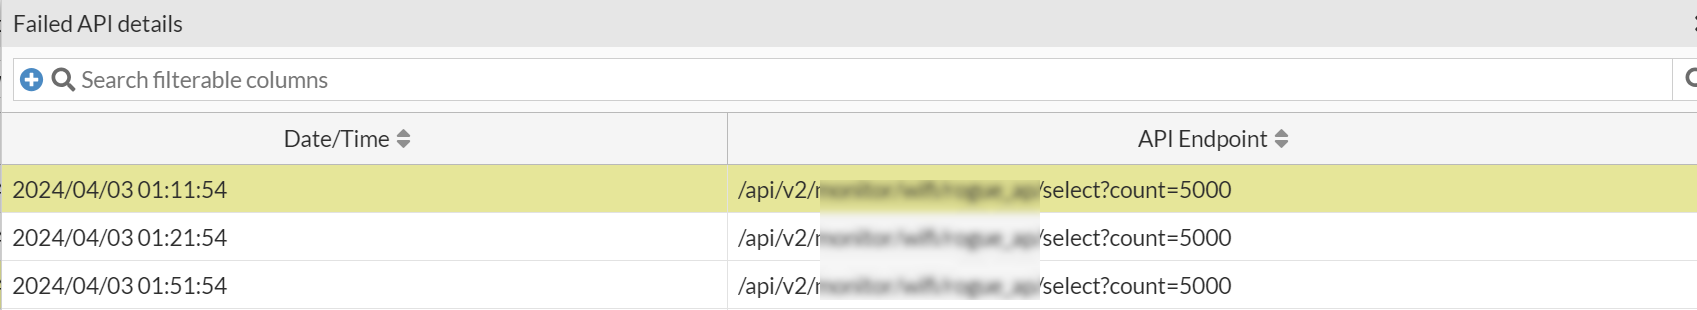
High Latency FortiGates
This widget displays the FortiGates with high latency determined based on the timed out API request. Hover over the graph to view the number of FortiGates with high latency at a given period of time and click on the graph to view the details of the FortiGates. You can select the period to view the FortiGates (10 or 30 minutes, 1 or 12 hours, or 1 day).
Note: This is not a default widget. To add it to your dashboard, click Add Widget and select it from the Manage Dashboard Widgets pane.
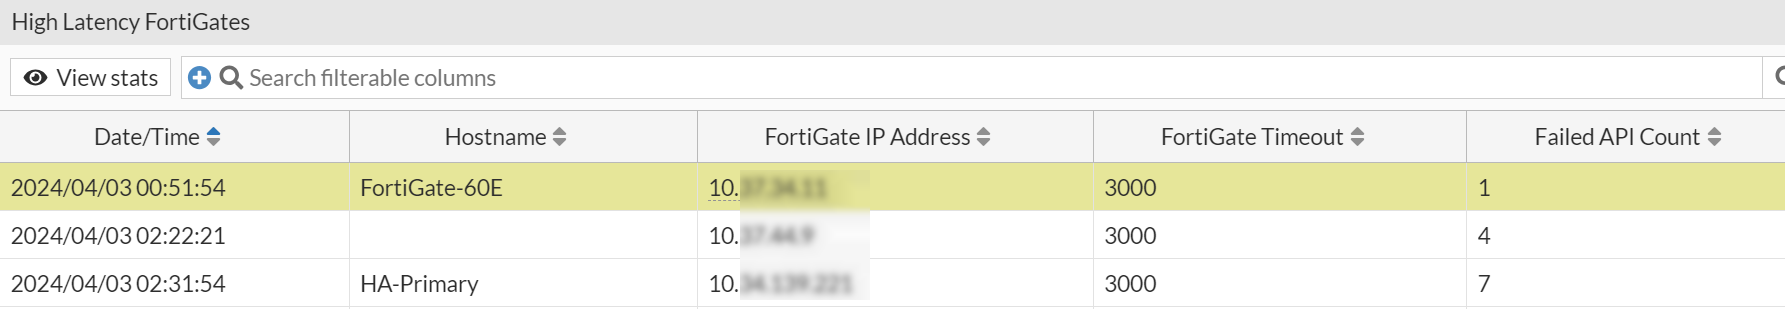
Select a particular FortiGate and click View stats to view the details of the timed out APIs.