
Wireless
The Wireless page gives you a complete picture of your wireless network. It displays key metrics such as the status, CPU usage, and memory usage of your Access Points, along with WIDS events for a selected time period. It also provides wireless client insights, a summary of rogue APs, and details of the top impacted applications and a full list of applications by usage.
The following charts are available in the Wireless page:
Access Points
This chart displays the total number of access points in your network and their status (Online, Offine, Waiting for Authorization, or Unknown).
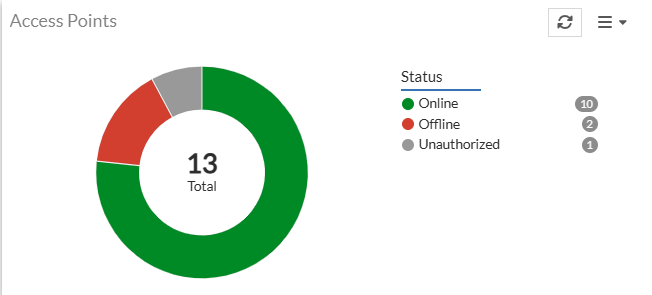
Click the chart for detailed information about the Access Points in use. For more information, see Access Points.
WIDS Events
This chart displays the threat type and the number of events for each type of threat.
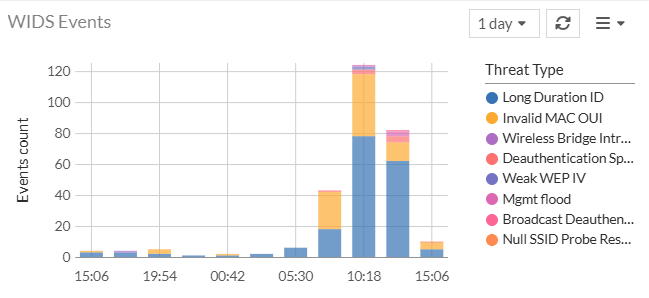
Click on a Threat Type to open WIDS Events pane with details for the filtered threat type.
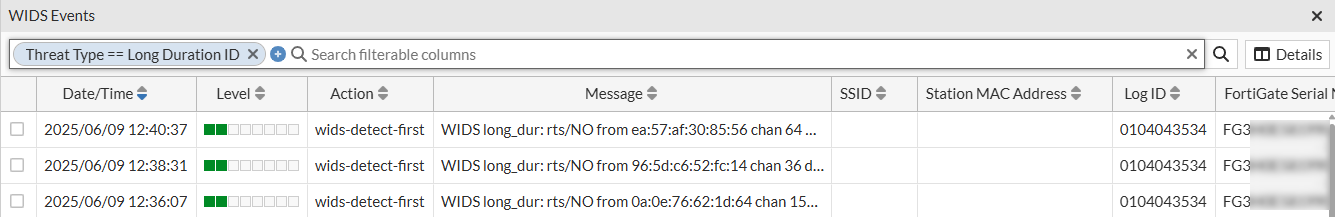
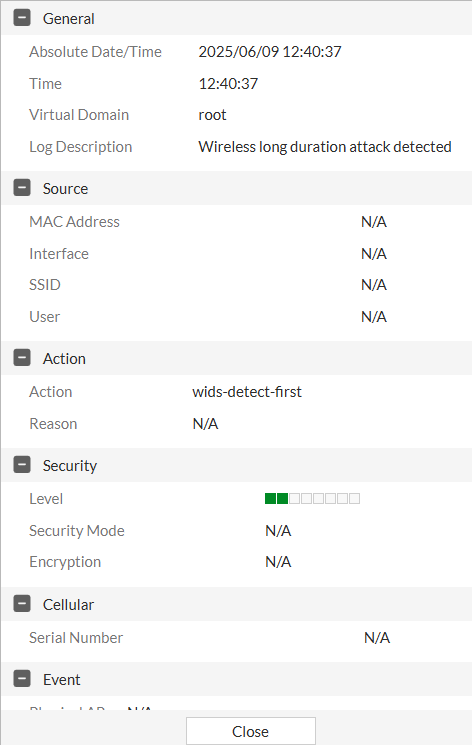
Double-click on an event to view more details
Access Points CPU Usage
This chart displays the real-time FortiAP CPU usage at a given time and categorizes it as Low, Medium, High, and Critical. You can select the period to view the resource usage (10 or 30 minutes, 1 or 12 hours, or 1 day).
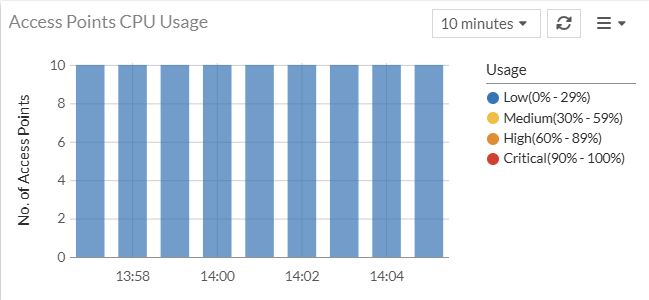
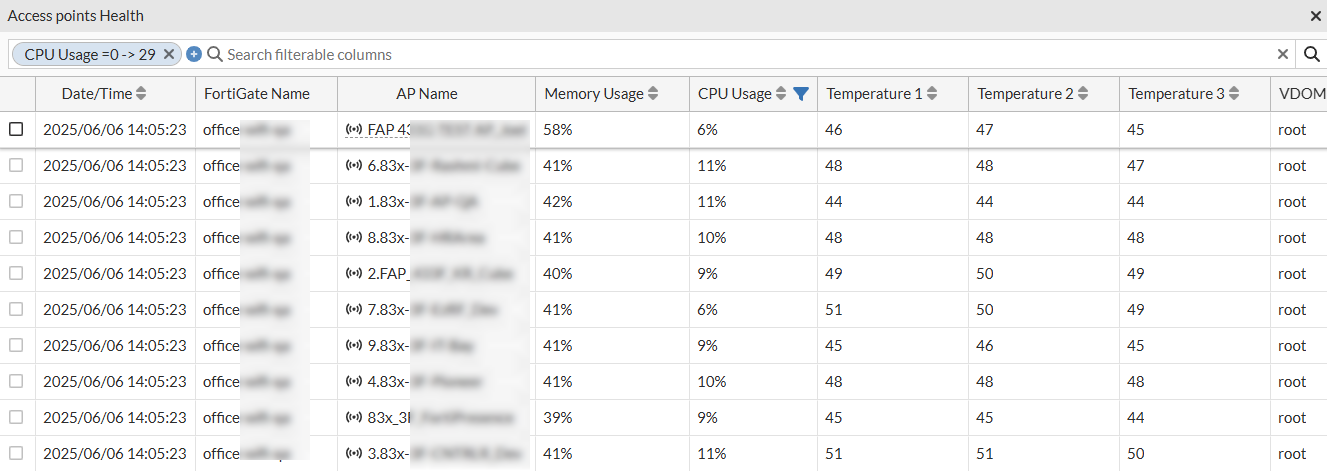
Click on the CPU usage chart to view more details.
Access Points Memory Usage
This chart shows real-time FortiAP memory usage, categorized into Low, Medium, High, and Critical levels. You can select the viewing period to see resource usage over 10 or 30 minutes, 1 or 12 hours, or 1 day.
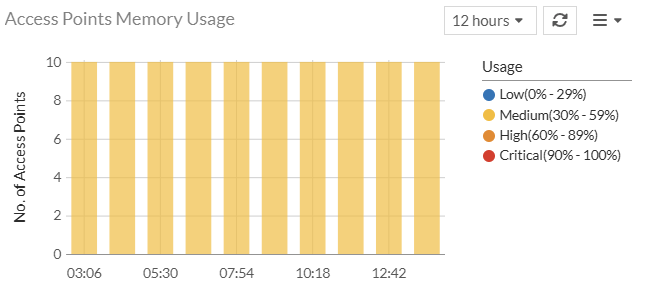
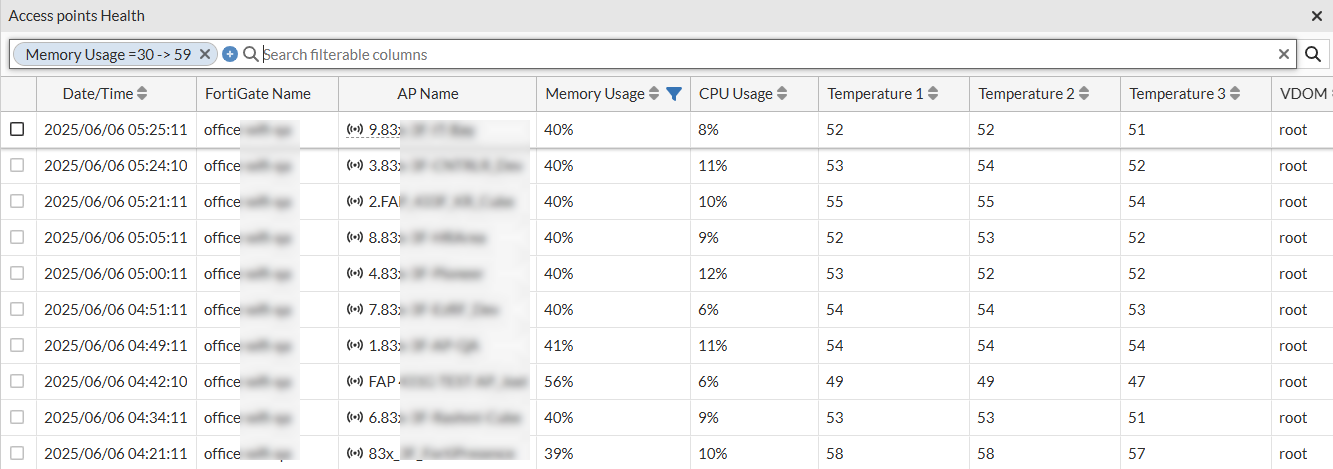
Click on the memory chart to view more details.
Wireless Clients
This chart displays the total number of connected clients with their Band categorization of 2.4GHz, 5GHz, and 6GHz. This panel also provides representation for clients based on the OS Type.
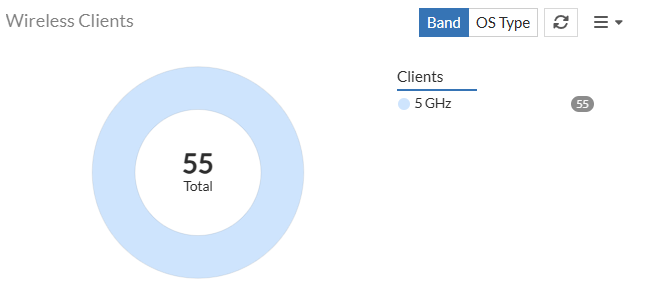
Click on the chart to view more details. For more information, see Wireless Clients.
Top 3 Impacted Apps
This panel displays the 3 conference applications running on client devices that are most impacted. These applications are Microsoft Teams calls, Google Meet, Zoom, WhatsApp audio and video call, and Apple FaceTime.
Note: This is not a default widget. To add it to your dashboard, click Add Widget and select it from the Manage Dashboard Widgets pane.
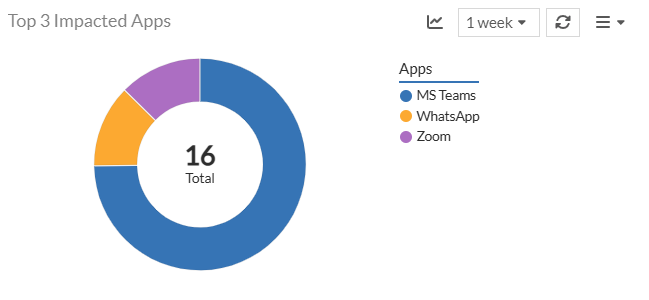
To view details, click on the name of the application on the chart or the panel.

The applications are classified as impacted based on the downtime it experiences during various sessions in the selected time period. You can view the downtime for the latest session and the number of sessions. Furthermore, click on the number of sessions to view the downtime and other details for each session.
Note: For accurate applications related data in this panel, renew the FortiGuard license for general updates, including application control signatures for application detection.
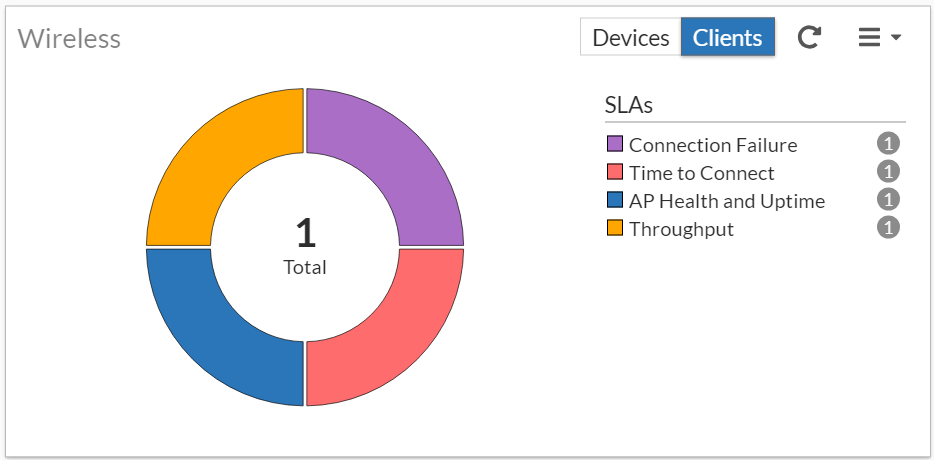
Wireless Insights
The Wireless panel displays the details of impacted SLAs with the associated device and client details. The Clients view displays the impacted client count and the Devices view displays the impacted AP count.
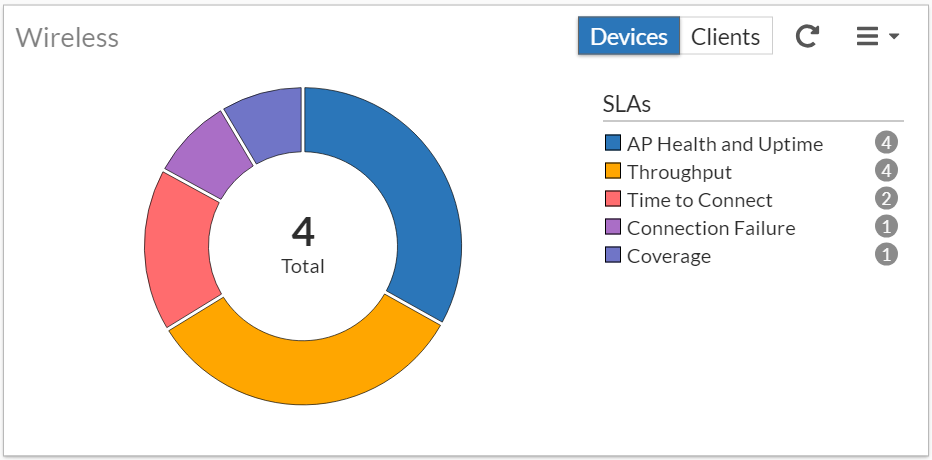
The impacted SLAs are detected and reported by FortiAIOps with device and client details. The issues reported are categorized based on classifiers and sub-classifiers, with suggested remedial measures to curtail the SLA breaches and enhance network performance. The data displayed in this panel is for the time period set in the dashboard. If you select the Devices view in the Wireless panel and click on any SLA in the impacted SLAs list or click on the bar in the chart, the impacted devices details such as, AP name, AP serial number, AP IP address, AP status (online/offline) and state, FortiGate host name and serial number, and classifier and sub-classifier are displayed.
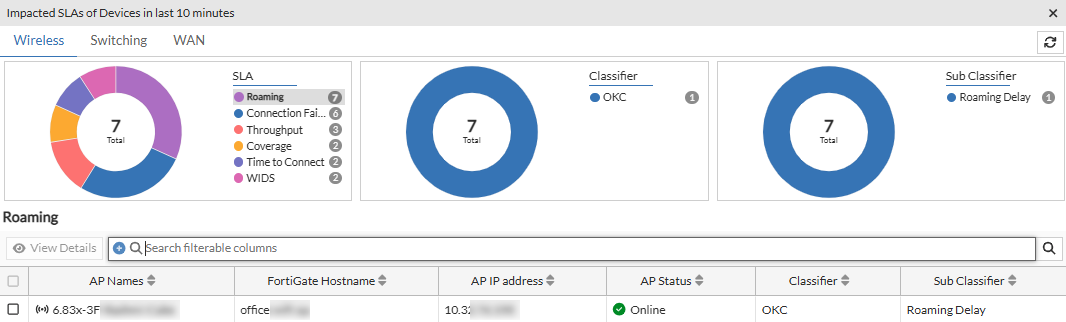
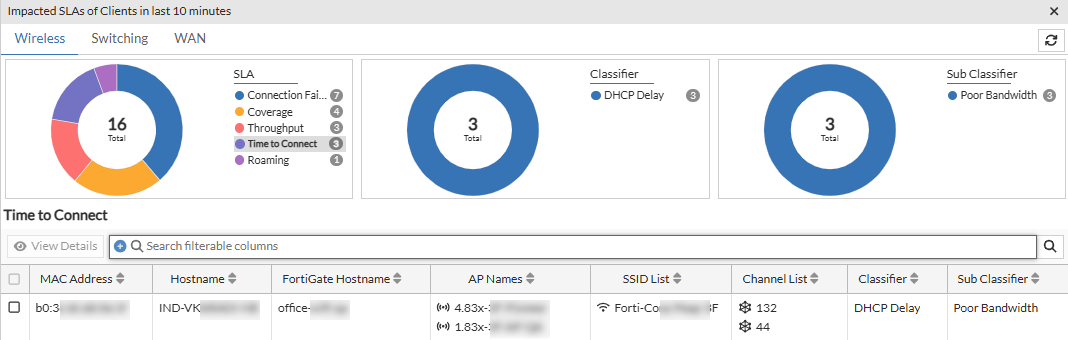
If you select the Clients view in the Wireless panel and click on any SLA in the impacted SLAs list or click on the bar in the chart, the impacted client details, such as, MAC address, hostname, associated SSID and channels, the AP name, IP address, and serial numbers, the associated FortiGate hostname and serial number, and the classifier and sub-classifers are displayed.
Select any row and click View Details to view a simplified topology with a visualization/illustration of the physical placement of devices, such as, FortiGates, FortiSwitches, and FortiAPs connected to each other in your network. This hierarchical pattern is representational; you cannot modify the placement of devices on this page. The topology displays the impacted devices, categorized based on their SLAs, classifiers, and sub-classifiers. The details of the topologies are described for each SLA in the following sections. You can toggle between different impacted SLAs on this page and filter data based on the impacted classifier and sub-classifier.
This SLA monitors your network for low throughput conditions and reports clients/devices based on dynamically configured threshold breaches.
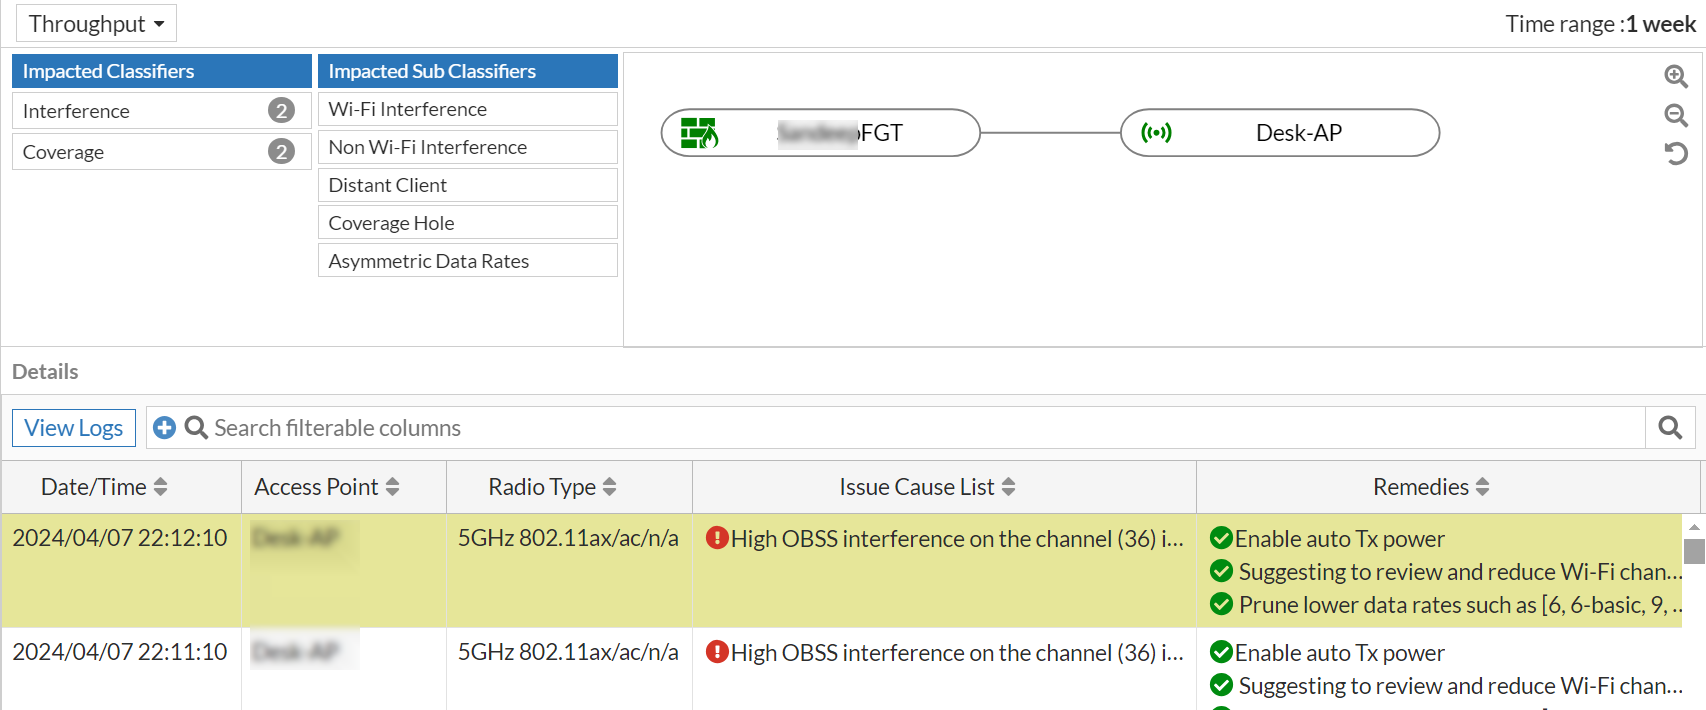
The Details table displays information such as the impacted radios for the reported classifiers and sub-classifiers, issue description and the suggested remediation measure, and so on are displayed. Right-click on the header of the table to select the columns that you wish to view.
|
Attribute |
Description |
|---|---|
| Date/Time | The date and time of the impact as per your timezone. |
| Classifiers | The classifier of the issue reported for the SLA. |
| Sub Classifiers | The sub-classifier of the issue for the reported classifier. |
|
Impacted Client Count |
The number of impacted clients. |
| Issue Cause List | Detailed cause of the SLA breach that impacted the client/AP/FortiGate. |
| Remedies | The suggested remedies to resolve the issue. |
|
Radio |
The AP radio that the client associated with. |
|
Access Point |
The AP name that the client associated with. |
|
AP Serial Number |
The AP serial number that the client associated with. |
|
Bandwidth Rx |
The Rx data throughput of the impacted AP. |
| Bandwidth Tx | The Tx data throughput of the impacted AP. |
|
FortiGate Hostname |
The hostname of the FortiGate associated with the AP/impacted client. |
|
FortiGate Serial |
The serial number of the associated FortiGate. |
| Radio Type | The impacted radio and band information. |
|
Radio Impacted Minutes |
The duration (in minutes) that the radio was impacted for. |
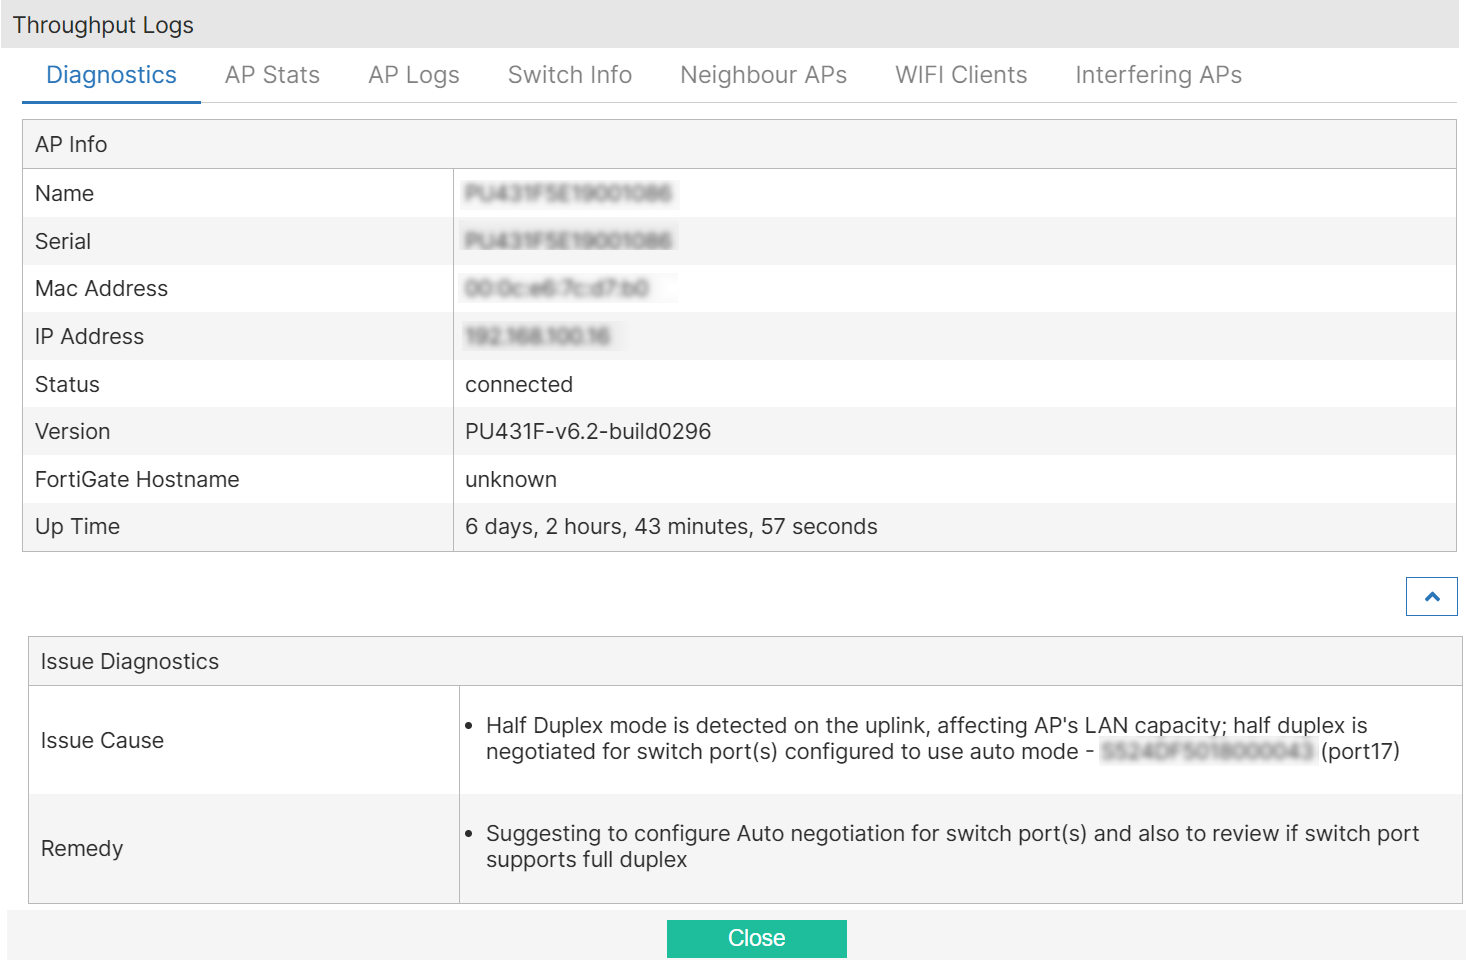
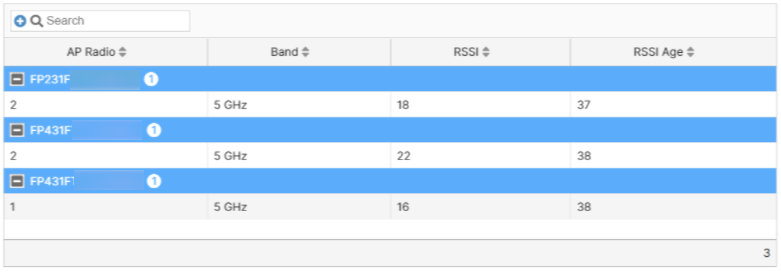
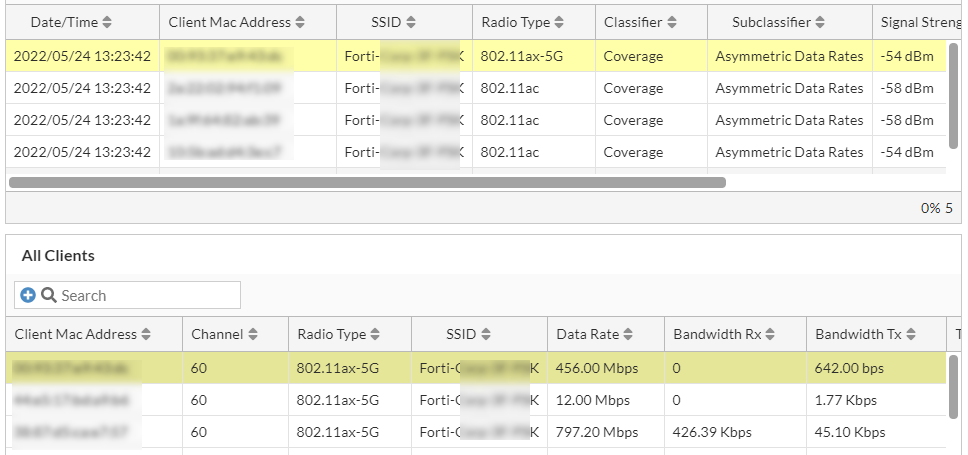
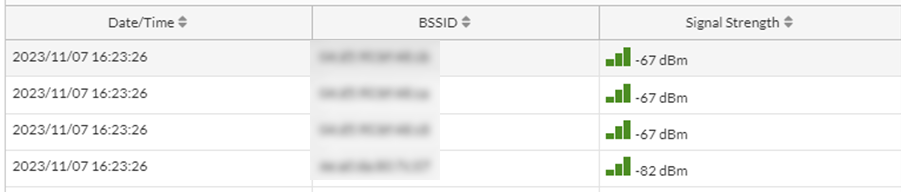
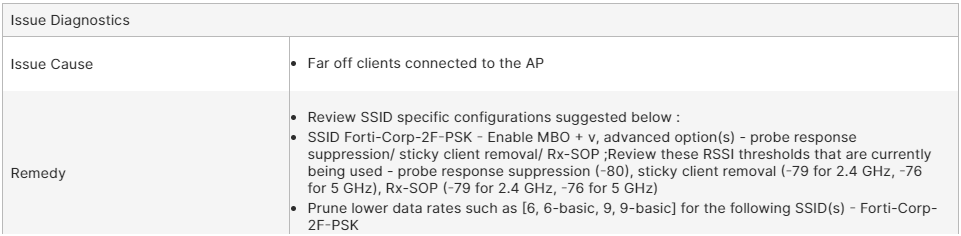
In the impacted details displayed, select a specific row of throughput failure and click View Details. You can view details of the impacted AP and issue diagnostics. You can view throughput logs related to Diagnostics with the issue description and the suggested remediation, AP Stats with the associated AP radio details, AP Logs with the time of the throughput failure event and the associated AP details, Switch Info with the switch port details connected to the AP, WIFI Clients with details of the impacted clients and a list of all WiFi clients, Interfering APs with the BSSID and the signal strength of the interfering APs.
|
Logs |
Description |
|---|---|
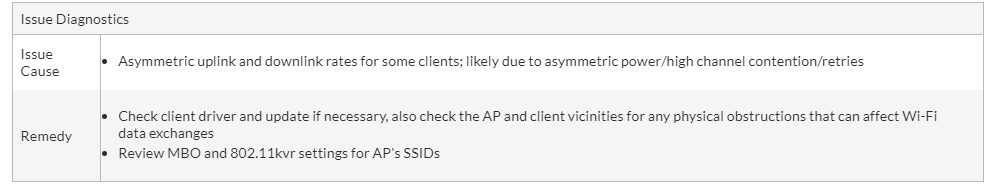
| Diagnostics |
This tab provides detailed cause of the SLA breach that impacted the client/AP/FortiGate. FortiAIOps also suggests the remedy to resolve the issue.
|
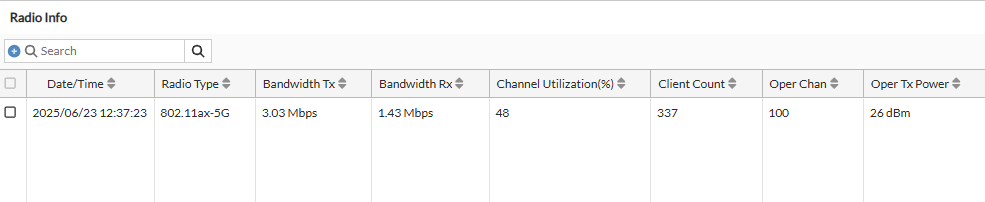
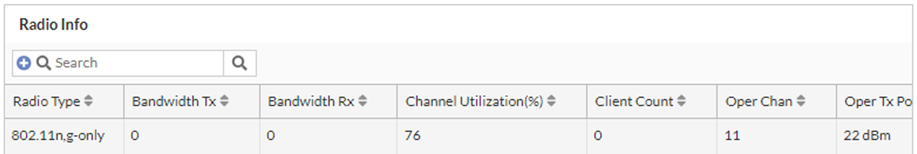
| AP Stats |
This tab displays the details of the AP radio that the client associated with and the WAN status details of the AP.
|
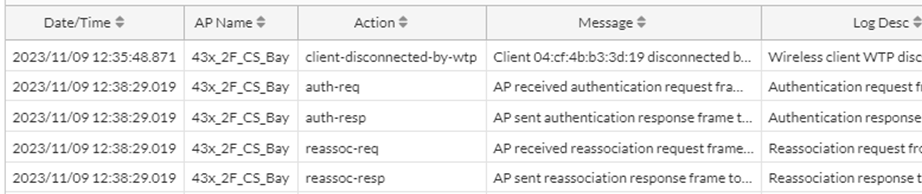
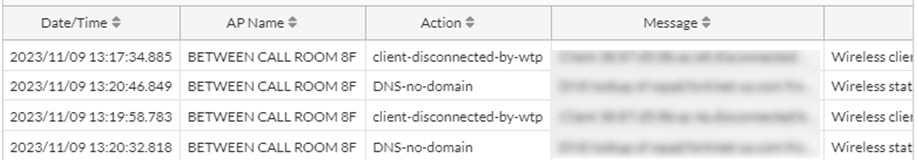
| AP Logs |
This tab provides the AP event logs generated from FortiGate.
|
|
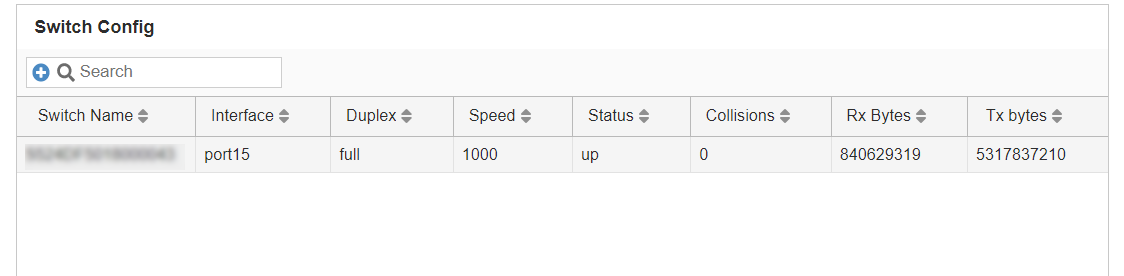
Switch Info |
This tab displays the configuration details of the switch port connected to the AP.
|
|
Neighbour APs |
This tab displays details of the detected neighbour APs by the client, for distant client & coverage hole issues.
|
|
WIFI Clients |
This tab provides details of the impacted clients and also lists all the clients associated with the AP.
|
|
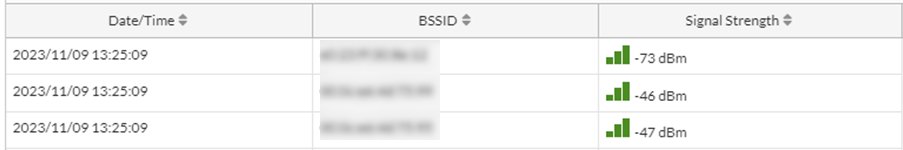
Interfering APs |
This tab displays details of the interfering APs in your network.
|
Displays the failed/unsuccessful client connections based on different stages of connection to a network. For example, association failures due to low RSSI, authentication failures due to unreachable RADIUS server, DHCP failure due to a DHCP server process crash, or DNS failure due to an invalid DNS domain.
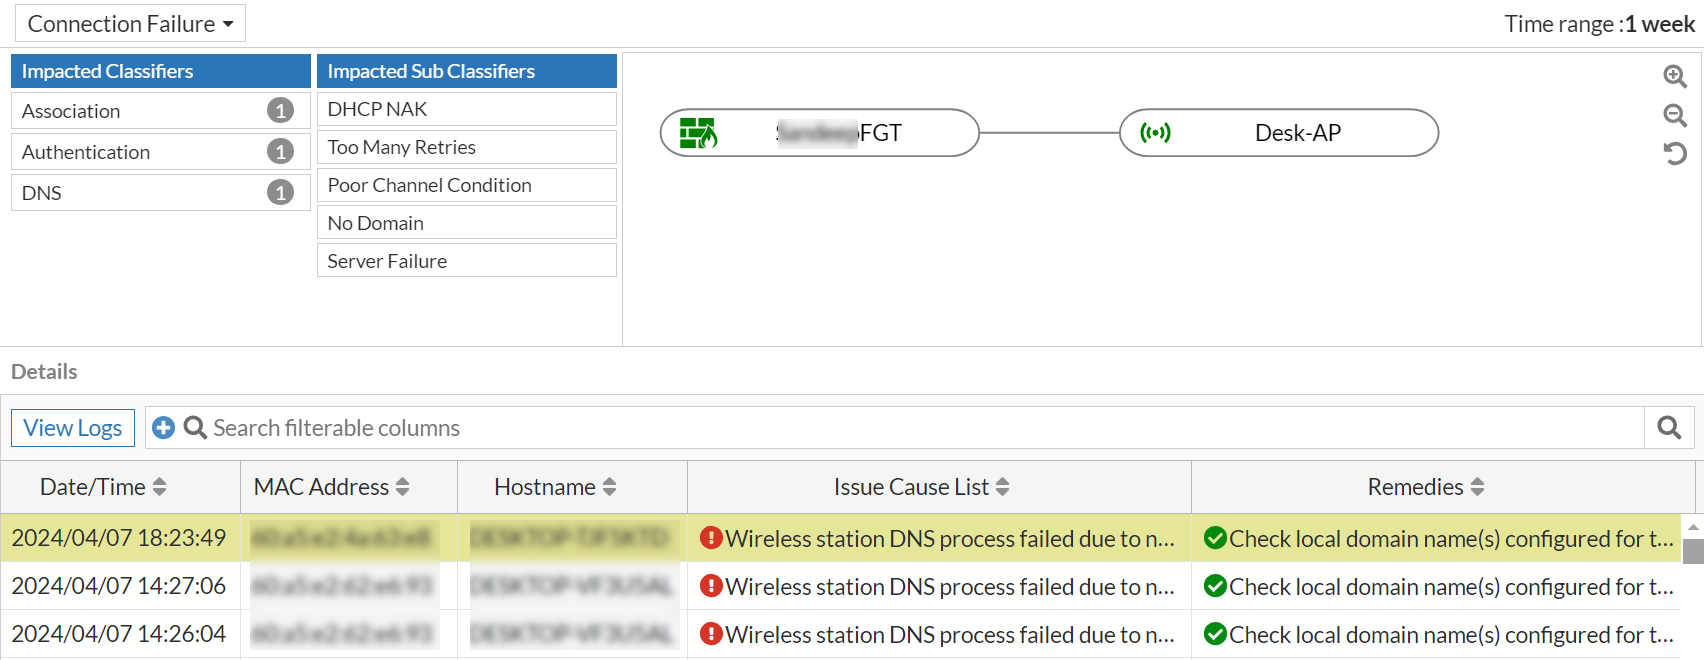
The Details table displays details such as the client MAC address, the associated AP serial number and the SSID, the issue classifier/category and the sub-classifier, the issue description and the suggested remediation measure, and so on are displayed. Right-click on the header of the table to select the columns that you wish to view.
|
Attribute |
Description |
|---|---|
| Date/Time | The date and time of the impact as per your timezone. |
| MAC Address | The MAC address of the impacted client device. |
| Hostname | The name of the device as configured by the user. If the name is not configured or available, then MAC address is displayed. |
| Access Point | The name of the AP that the impacted client associated with. |
| SSID | The SSID that the impacted client is associated with. |
| Classifier | The classifier of the issue reported for the SLA. |
| Sub Classifier | The sub-classifier of the issue for the reported classifier. |
| Issue Cause List | The detailed causes of the SLA breach that impacted the client/AP/FortiGate. |
| Remedies | The suggested remedies to resolve the issue. |
|
AP Serial Number |
The AP serial number that the client associated with. |
|
FortiGate Hostname |
The hostname of the FortiGate associated with the AP/impacted client. |
|
FortiGate Serial |
The serial number of the associated FortiGate. |
|
User Name |
The impacted client user name. |
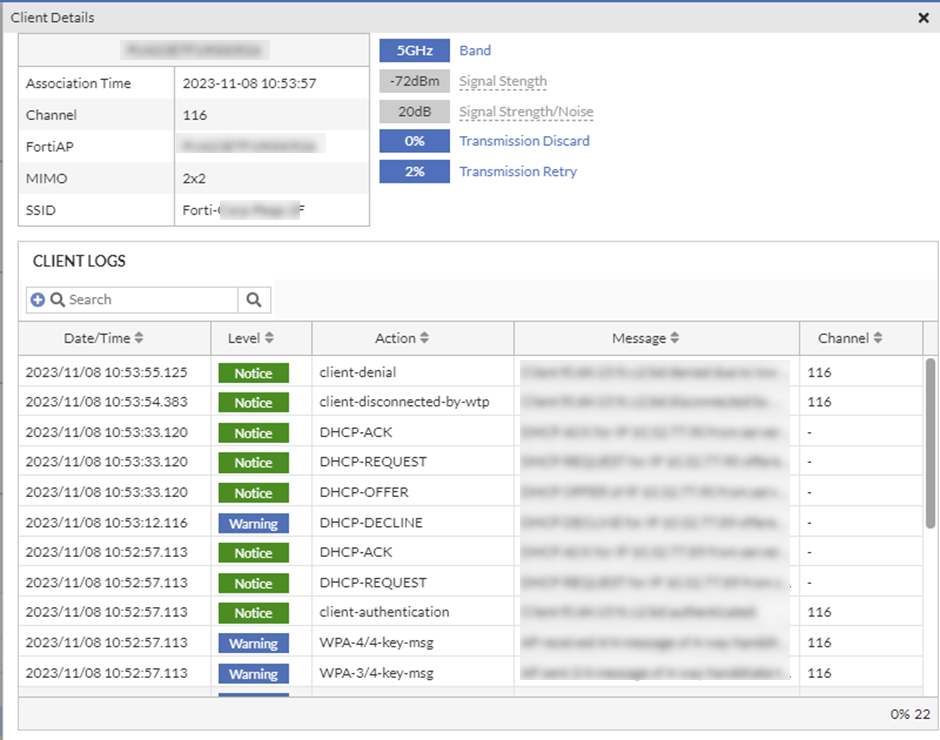
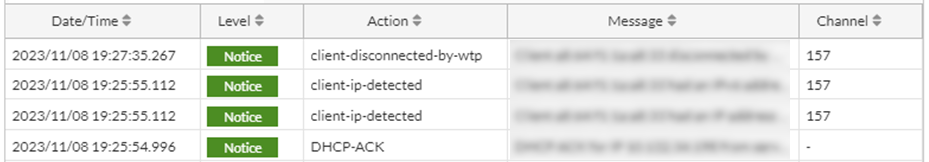
Select a specific client and click View Logs. You can view Client Details such as the client device name, the name of the AP it is associated with and the time of association, associated SSID, and operational details such as the channel and the MIMO mode. The client Status such as the associated bandwidth (2.5GHZ/5GHZ), signal strength (RSSI), signal noise, rate of transmission discard and rate of transmission retry between the client and the AP. The Client Logs display the time stamp of each action and action classification as notice, warning, etc., and the action details and the associated channel.
Displays the details of clients that breach the SLA threshold values for these stages of connection, Association, Authentication, DHCP, and DNS. The actual value of time taken and the configured Time to Connect threshold values (static/dynamic) are compared. For SLA configurations, see Time To Connect
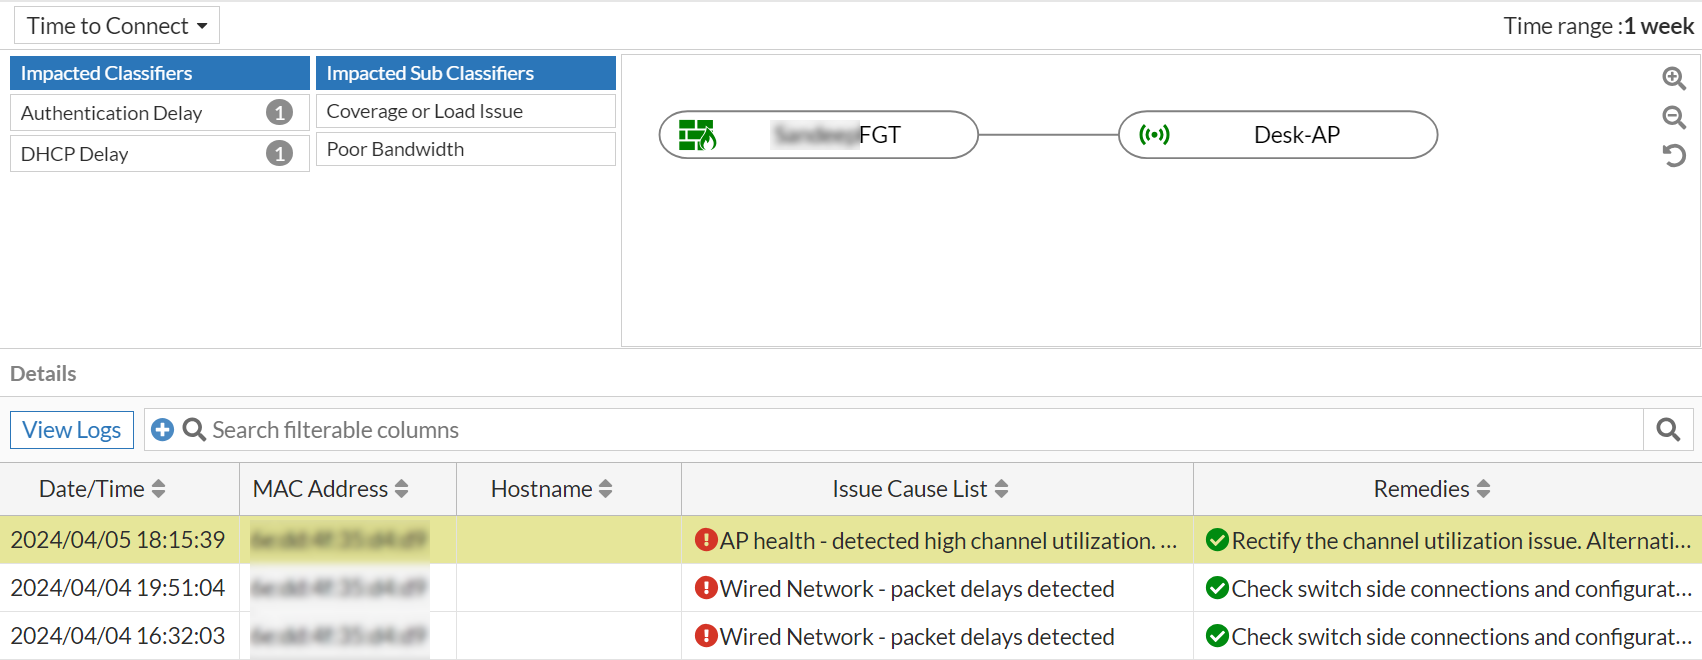
The Details table displays details such as the client MAC address, the associated AP serial number and the SSID, the issue classifier/category and the sub-classifier, the issue description and the suggested remediation measure, and so on are displayed. Right-click on the header of the table to select the columns that you wish to view.
|
Attribute |
Description |
|---|---|
| Date/Time | The date and time of the impact as per your timezone. |
| MAC Address | The MAC address of the impacted client device. |
| Hostname | The name of the device as configured by the user. If the name is not configured or available, then MAC address is displayed. |
| SSID | The SSID that the impacted client is associated with. |
| Classifier | The classifier of the issue reported for the SLA. |
| Sub Classifier | The sub-classifier of the issue for the reported classifier. |
| Signal Strength | The signal strength of the client at the time of impact. |
| Issue Cause List | The detailed causes of the SLA breach that impacted the client/AP/FortiGate. |
| Remedies | The suggested remedies to resolve the issue. |
| Access Point | The name of the access point that the client associated with. |
|
AP Serial Number |
The AP serial number that the client associated with. |
|
FortiGate Hostname |
The hostname of the FortiGate associated with the AP/impacted client. |
|
FortiGate Serial |
The serial number of the associated FortiGate. |
|
User Name |
The impacted client user name. |
|
Association Delay |
The association delay measured in milliseconds. |
| Association Time | The total time taken by the client for association. |
|
Authentication Delay |
The authentication delay measured in milliseconds. |
| Authentication Time | The total time taken by the client for authentication. |
|
DNS Delay |
The DNS delay measured in milliseconds. |
| DNS Time | The total time taken by the client to resolve the DNS request. |
|
DHCP Delay |
The DHCP delay measured in milliseconds. |
| DHCP Time | The total time taken by a client to receive a DHCP address. |
Select a specific row and click View Logs to view the raw logs associated with the impacted client. You can view Client Details such as the client device name, the name of the AP it is associated with and the time of association, associated SSID, and operational details such as the channel and the MIMO mode. The client Status such as the associated bandwidth (2.5GHZ/5GHZ), signal strength (RSSI), signal noise, rate of transmission discard and rate of transmission retry between the client and the AP. The Client Logs display the time stamp of each action and action classification as notice, warning, etc., and the action details and the associated channel.
This SLA monitors your network for coverage issues and reports clients/devices based on dynamically configured threshold breaches.
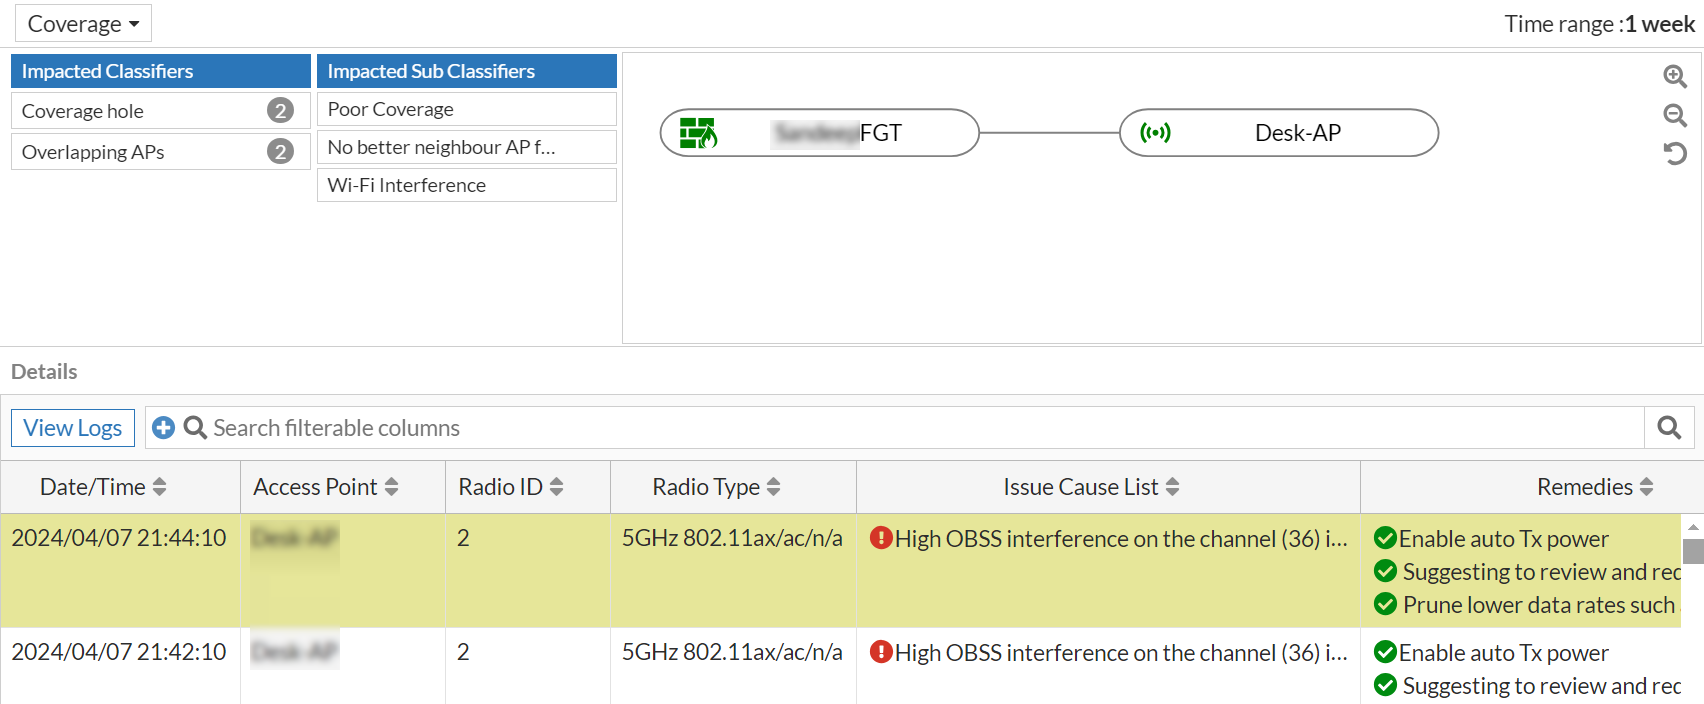
The Details table displays issue details such as the radio type, Tx power, neighbour AP count, the issue classifier/category and the sub-classifier, the issue description and the suggested remediation measure, and so on are displayed. Right-click on the header of the table to select the columns that you wish to view.
|
Attribute |
Description |
|---|---|
| Date/Time | The date and time of the impact as per your timezone. |
| Access Point | The name of the FortiAP. |
| Classifiers | The classifiers of the issue reported for the SLA. |
| Sub Classifiers | The sub-classifiers of the issue for the reported classifier. |
| Issue Cause List | The detailed causes of the SLA breach that impacted the client/AP/FortiGate. |
| Remedies | The suggested remedies to resolve the issue. |
|
Radio ID |
The AP radio that the client associated with. |
| Radio Type | The impacted radio and band information associated with the client. |
| Radio Impacted Minutes | The duration of time (in minutes) that the Radio was impacted. |
|
AP Serial Number |
The AP serial number that the client associated with. |
| TX Power | The Tx power of the AP at the time of impact. |
|
FortiGate Hostname |
The hostname of the FortiGate associated with the AP/impacted client. |
|
FortiGate Serial |
The serial number of the associated FortiGate. |
| Radio Type | The impacted radio and band associated with the client. |
|
Channel |
The channel at which the client connected. |
|
Impacted Client Count |
The number of impacted clients. |
| Interfering AP | The list of interfering APs in the network. |
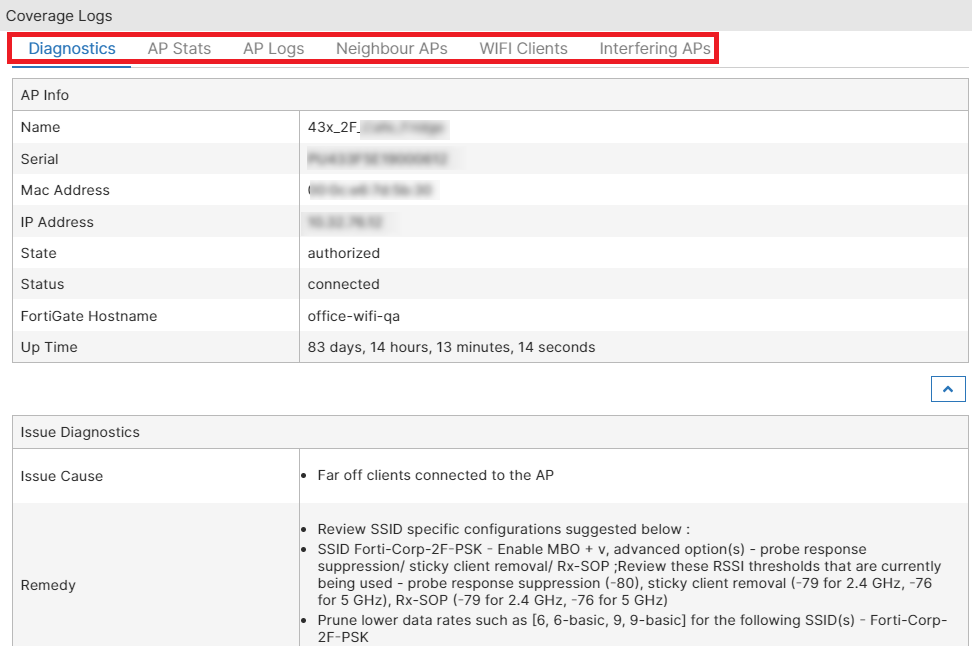
To view the logs, select a specific row of an AP event and click View Logs. You can view coverage logs related to Diagnostics with the issue description and the suggested remediation, AP Stats with the associated AP radio details, AP Logs with the time of the throughput failure event and the associated AP details, Switch Info with the switch port details connected to the AP, WIFI Clients with details of the impacted clients and a list of all WiFi clients, Interfering APs with the BSSID and the signal strength of the interfering APs.
|
Logs |
Description |
|---|---|
| Diagnostics |
This tab provides detailed cause of the SLA breach that impacted the client/AP/FortiGate. FortiAIOps also suggests the remedy to resolve the issue.
|
| AP Stats |
This tab displays the details of the AP radio that the client associated with and the WAN status details of the AP.
|
| AP Logs |
This tab provides the AP event logs generated from FortiGate.
|
|
WIFI Clients |
This tab provides details of the impacted clients and also lists all the clients associated with the AP.
|
|
Interfering APs |
This tab displays details of the interfering APs in your network.
|
Slow roaming clients are detected based on the variation of the classifier threshold values set by the users or calculated dynamically by FortiAIOps. The parameters to identify slow roaming clients are Fast BSS Transition Roams, PMK Cache, and Opportunistic Key Caching Roams. Any breach in the threshold values are detected and reported. For SLA configurations, see Roaming.
The Details table displays details such as the client MAC address, the associated AP serial number and the SSID, the issue classifier/category and the sub-classifier, the issue description and the suggested remediation measure, and so on. Right-click on the header of the table to select the columns that you wish to view.
|
Attribute |
Description |
|---|---|
| Date/Time | The date and time of the impact as per your timezone. |
| MAC Address | The MAC address of the impacted client device. |
| Device | The name of the device as configured by the user. If the name is not configured or available, then MAC address is displayed. |
| SSID | The SSID that the impacted client is associated with. |
| Classifier | The classifier of the issue reported for the SLA. |
| Sub Classifier | The sub-classifier of the issue for the reported classifier. |
| Roaming Delay | The delay (latency) in client roaming (milliseconds) in case of threshold breach. |
|
Roaming Time |
The duration of time the client was roaming the network. |
|
Radio ID |
The AP radio that the client associated with. |
| Radio Type | The impacted radio and band information. |
|
AP Serial Number |
The AP serial number that the client associated with. |
|
Channel |
The channel at which the AP/client were operating. |
| Issue Cause List | detailed cause of the SLA breach that impacted the client/AP/FortiGate. |
| Remedies | The suggested remedies to resolve the issue. |
| Access Point | The name of the access point. |
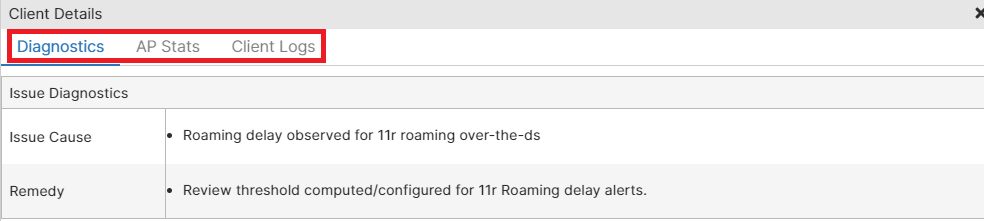
To view the logs, select a specific row of an AP event and click View Logs. You can view client details such as Diagnostics with the issue description and the suggested remediation, AP Stats with the associated AP radio details, and Client Logs with details of the impacted clients.
|
Logs |
Description |
|---|---|
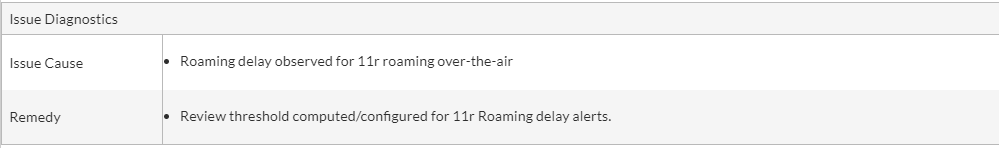
| Diagnostics |
This tab provides detailed cause of the SLA breach that impacted the client. FortiAIOps also suggests the remedy to resolve the issue.
|
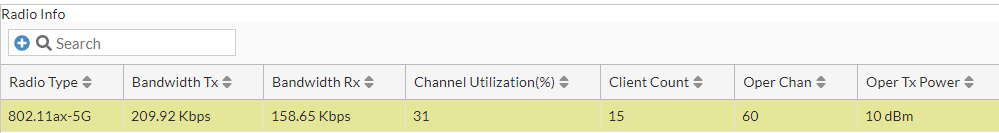
| AP Stats |
This tab displays the details of the AP radio that the client associated with.
|
| Client Logs |
This tab provides client event logs.
|
In the various throughput logs displayed, you can right-click on the table header to select the details you want to view.
Displays the AP health based on the configured AP health threshold values and the AP down status due to AP/FortiGate reboot, disabled switch port etc. For SLA configurations, see Device Health
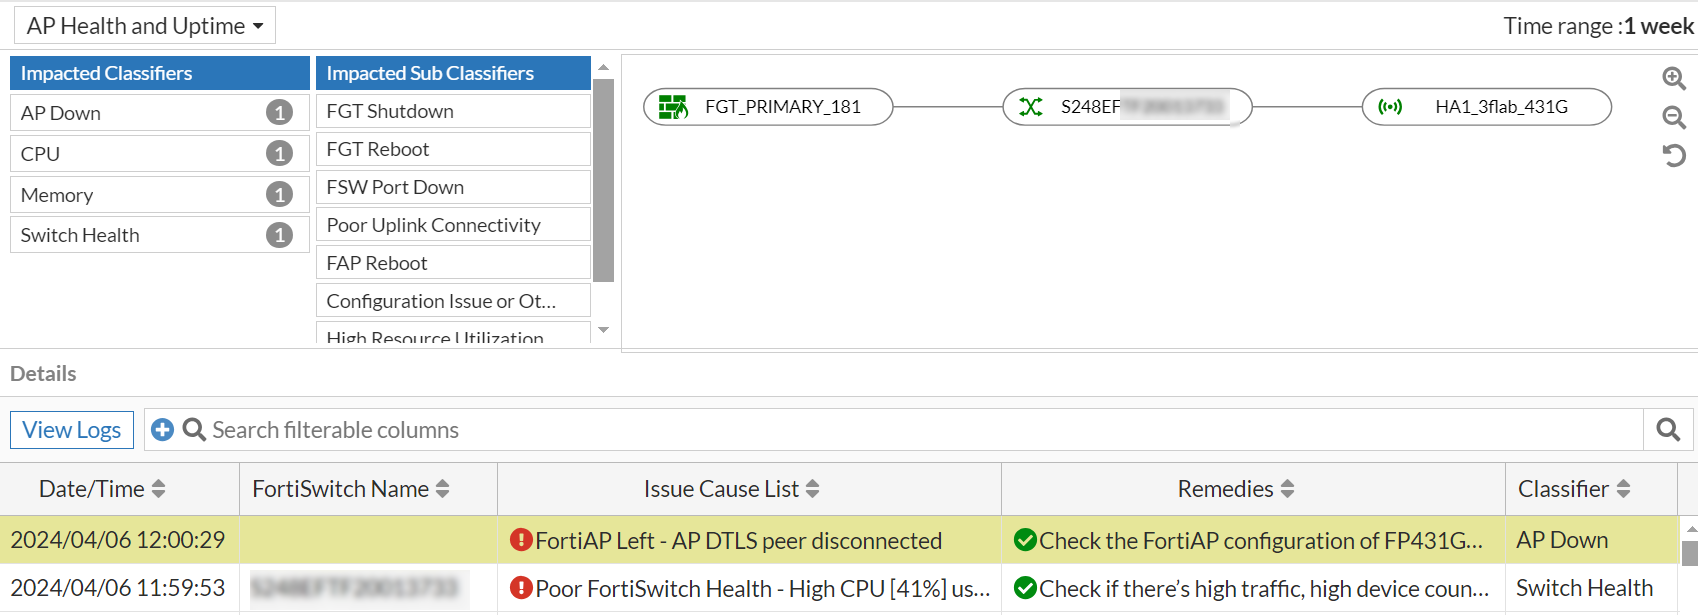
The Details table displays issue details such as the issue classifier/category and the sub-classifier, the issue description and the suggested remediation measure, and so on. Right-click on the header of the table to select the columns that you wish to view.
|
Attribute |
Description |
|---|---|
| Date/Time | The date and time of the impact as per your timezone. |
| FortiSwitch Name | The name of the switch associated with the impacted AP/client. |
| Issue Cause List | The detailed causes of the SLA breach that impacted the client/AP/FortiGate. |
| Remedies | The suggested remedies to resolve the issue. |
| Classifier | The classifier of the issue reported for the SLA. |
| Sub Classifier | The sub-classifier of the issue for the reported classifier. |
|
AP Serial Number |
The AP serial number that the client associated with. |
|
FortiGate Hostname |
The hostname of the FortiGate associated with the AP/impacted client. |
|
FortiGate Serial Number |
The serial number of the associated FortiGate. |
|
FortiSwitch Serial Number |
The serial number of the switch associated with the impacted AP/client. |
In the AP events displayed, select an event and click View Logs.
|
Logs |
Description |
|---|---|
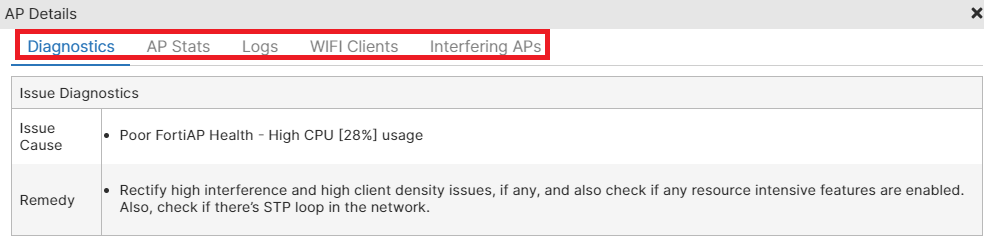
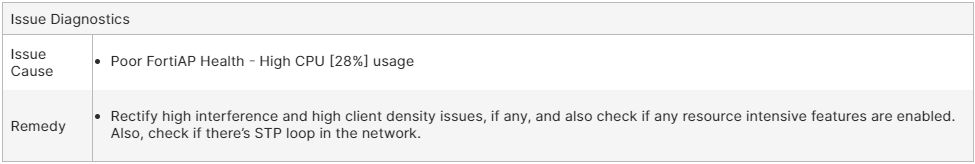
| Diagnostics |
This tab provides detailed cause of the SLA breach that impacted the client/AP/FortiGate. FortiAIOps also suggests the remedy to resolve the issue.
|
| AP Stats |
This tab displays the details of the AP radio that the client associated with and the WAN status details of the AP.
|
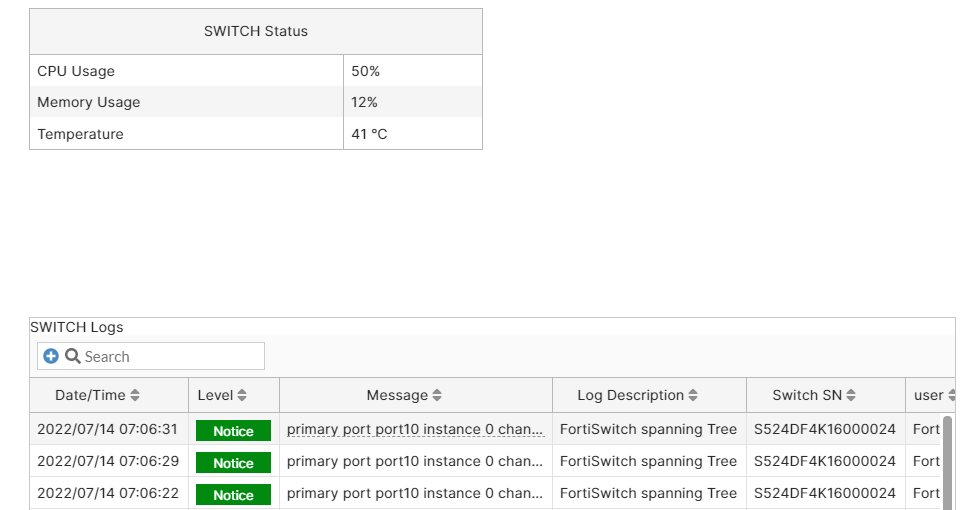
| Logs |
|
|
WIFI Clients |
This tab provides details of the impacted clients and also lists all the clients associated with the AP.
|
|
Interfering APs |
This tab displays details of the interfering APs in your network.
|
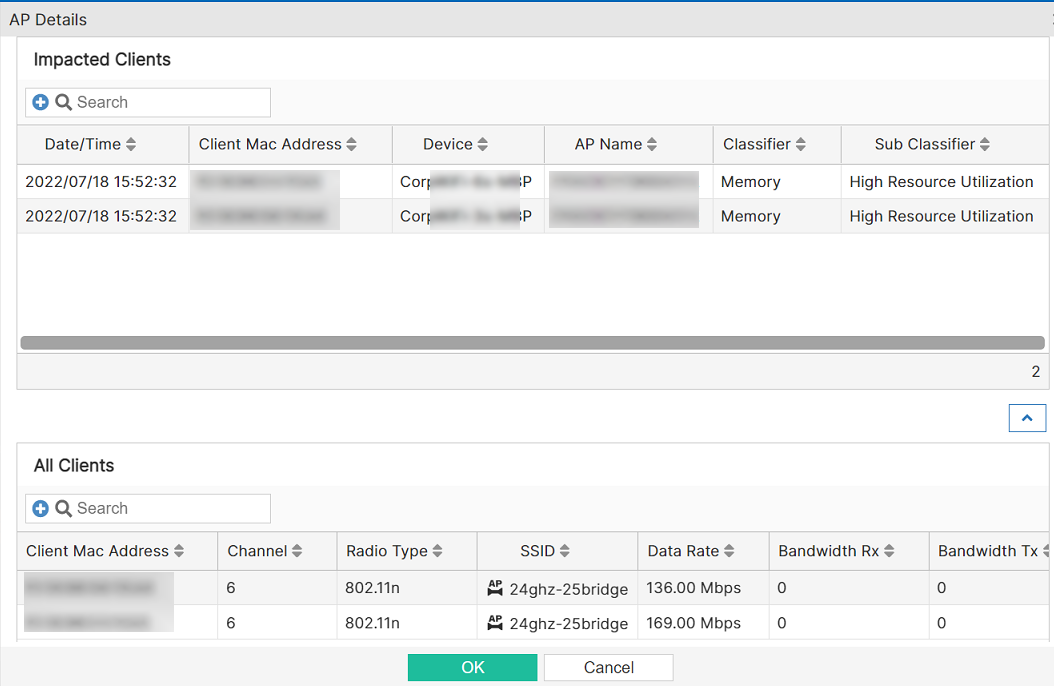
Select any impacted client and click Show AP details to view the detailed AP logs.
Select any of the tabs to view the data described in this table.
|
Logs |
Description |
|---|---|
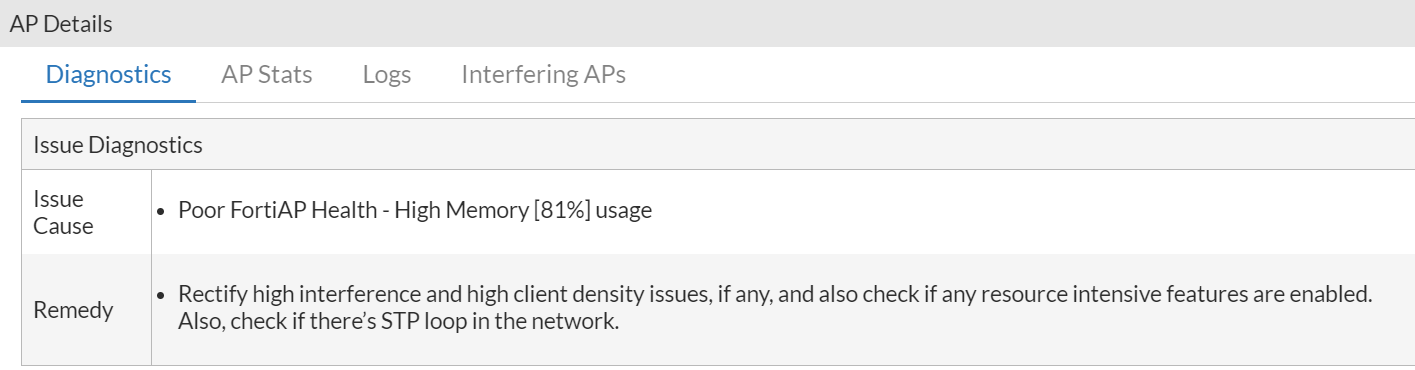
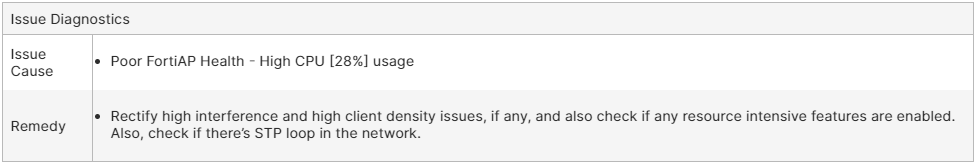
| Diagnostics |
This tab provides detailed cause of the SLA breach that impacted the client/AP/FortiGate. FortiAIOps also suggests the remedy to resolve the issue.
|
| AP Stats |
This tab displays the details of the AP radio that the client associated with and the WAN status details of the AP.
|
|
Interfering APs |
This tab displays details of the interfering APs in your network.
|
| Logs | This tab provides the AP event logs generated from FortiGate. |
The WIDS SLA monitors and reports on potential events detected within the network by the WIDS (Wireless Intrusion Detection System) system. It detects security threats and recommends corrective actions to maintain network integrity, enhancing security with real-time alerts and actionable insights for faster threat resolution.
The following types of intrusion detection is available:
|
Intrusion Type |
Description |
|---|---|
| Broadcast Deauthentication | This is a type of Denial of Service attack. A flood of spoofed de-authentication frames forces wireless clients to de-authenticate, then re-authenticate with their AP. |
| Long Duration ID | To share radio bandwidth, WiFi devices reserve channels for brief periods of time. Excessively long reservation periods can be used as a denial of service attack. You can set a threshold between 1000 and 32 767 microseconds. The default is 8200. |
| Authentication Frame Flood | A Denial of Service attack using a large number of association requests. The default detection threshold is 30 requests in 10 seconds. |
| Association Frame Flood | A Denial of Service attack using a large number of association requests. The default detection threshold is 30 requests in 10 seconds. |
| Deauthentication Spoof | Spoofed de-authentication frames are a denial of service attack. They cause all clients to disconnect from the AP. |
| EAPOL Flood attacks | Extensible Authentication Protocol over LAN (EAPOL) packets are used in WPA and WPA2 authentication. Flooding the AP with these packets can be a denial of service attack. Several types of EAPOL packets are detected: EAPOL-FAIL, EAPOL-LOGOFF, EAPOL-START, EAPOL-SUCC. |
| Wireless Bridge Intrusion | WiFi frames with both the fromDS and ToDS fields set indicate a wireless bridge. This will also detect a wireless bridge that you intentionally configured in your network. |
| Null SSID Probe Response | When a wireless client sends out a probe request, the attacker sends a response with a null SSID. This causes many wireless cards and devices to stop responding. |
|
Invalid Mac OUI |
Some attackers use randomly-generated MAC addresses. The first three bytes of the MAC address are the Organizationally Unique Identifier (OUI), administered by IEEE. Invalid OUIs are logged. |
|
Weak WEP IV |
A primary means of cracking WEP keys is by capturing 802.11 frames over an extended period of time and searching for patterns of WEP initialization vectors (IVs) that are known to be weak. WIDS detects known weak WEP IVs in on-air traffic. |
|
ASLEAP Attack |
ASLEAP is a tool used to perform attacks against LEAP authentication. |
Select WIDS SLA from the chart and from the WIDS table select a row and click View Details.
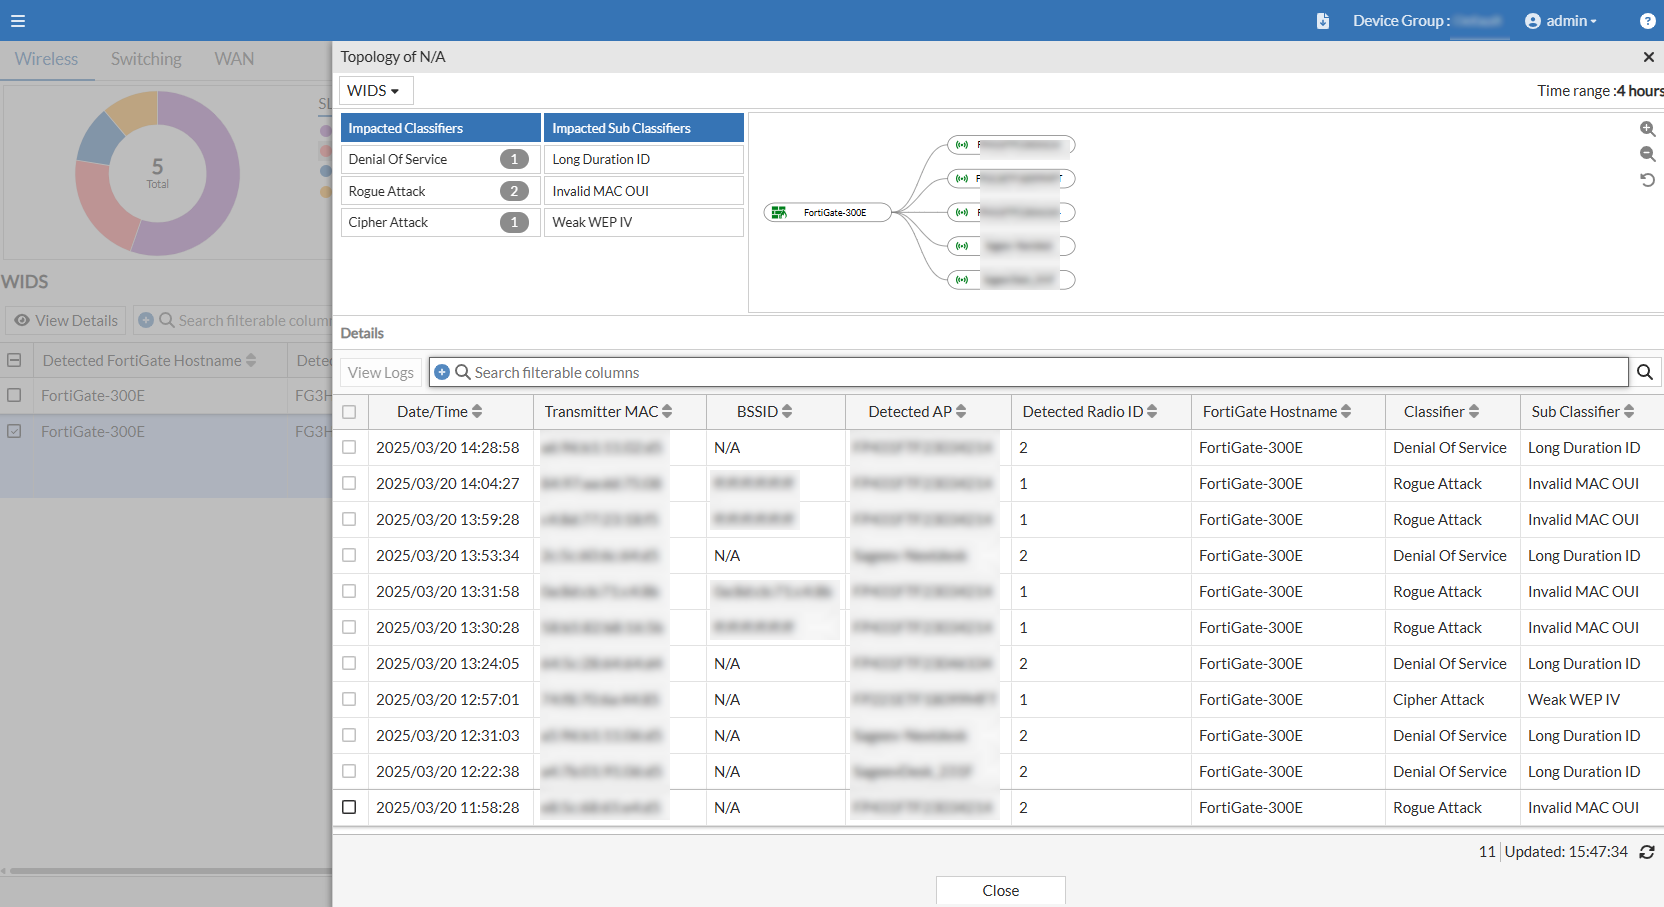
WIDS SLAs are categorized based on the severity and potential impact of detected wireless intrusion events mentioned above. These events are classified into the following categories:
-
Denial of Service
-
Misconfigured Packet
-
Rogue Attack
-
Cipher Attack
-
Tool Attack
The Details table displays information such as the Detected FortiGate Hostname, Detected FortiGate, Affected AP Serial Number, Detected FortiGate IP Address, Classifier, Sub Classifier, Affected AP IP Address, Affected AP Name, Affected AP State, and Affected AP Status. Right-click on the header of the table to select the columns that you want to view.
The following table lists all the attributes listed in the Details table:
|
Attribute |
Description |
|---|---|
| Detected FortiGate Hostname | The hostname of the FortiGate associated with AP detecting WIDS events. |
| Detected FortiGate | Name of the FortiGate in which AP detecting WIDS is connected. |
| Affected AP Serial Number | Serial number of Access Point detecting WIDS event. |
| Detected FortiGate IP Address | IP address of the FortiGate in which AP detecting WIDS is connected. |
| Classifier | The classifier of the issue reported for the SLA. |
| Sub Classifier | The sub-classifier of the issue for the reported classifier. |
| Affected AP IP Address | IP address of Access Point detecting WIDS event. |
| Affected AP Name | Name of Access Point detecting WIDS event. |
|
Affected AP State |
State of Access Point detecting WIDS event. |
|
Affected AP Status |
Status of Access Point detecting WIDS event. |
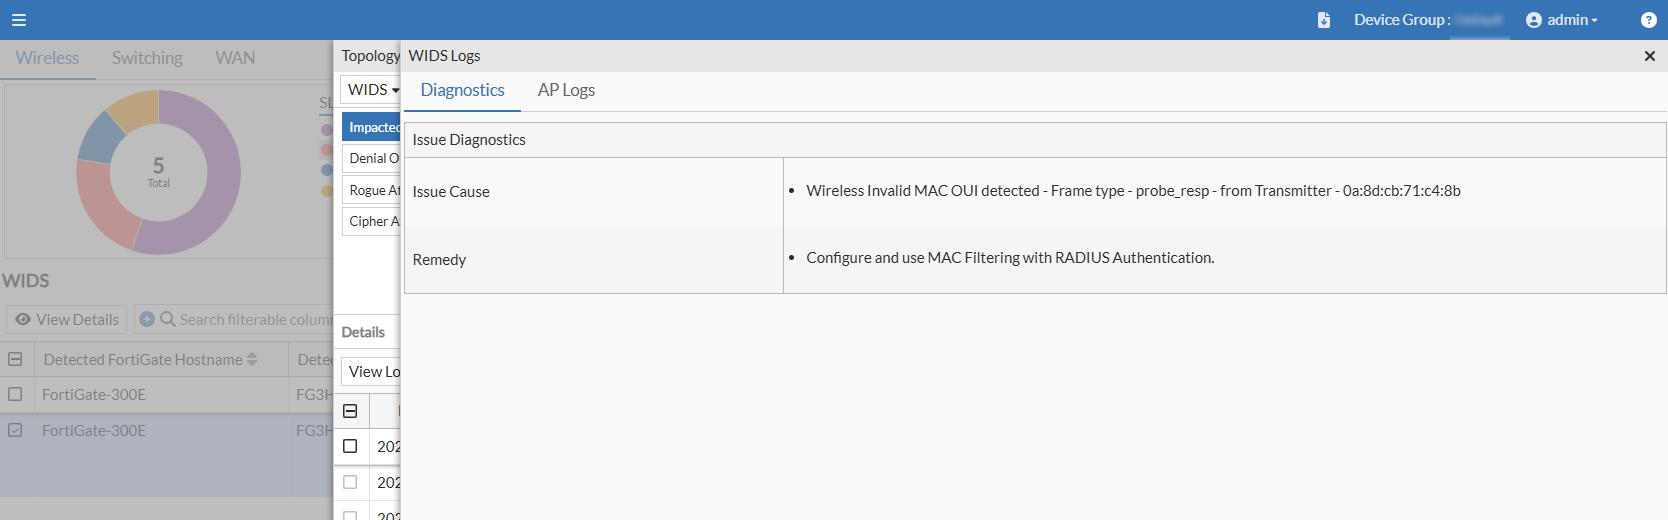
Select a specific row and click View Logs. The WIDS Logs window displays detailed logs in two tabs namely – Diagnostics and AP Logs.
The Diagnostics tab displays diagnostics details such as Issue Cause and Remedy suggested to resolve the issue.
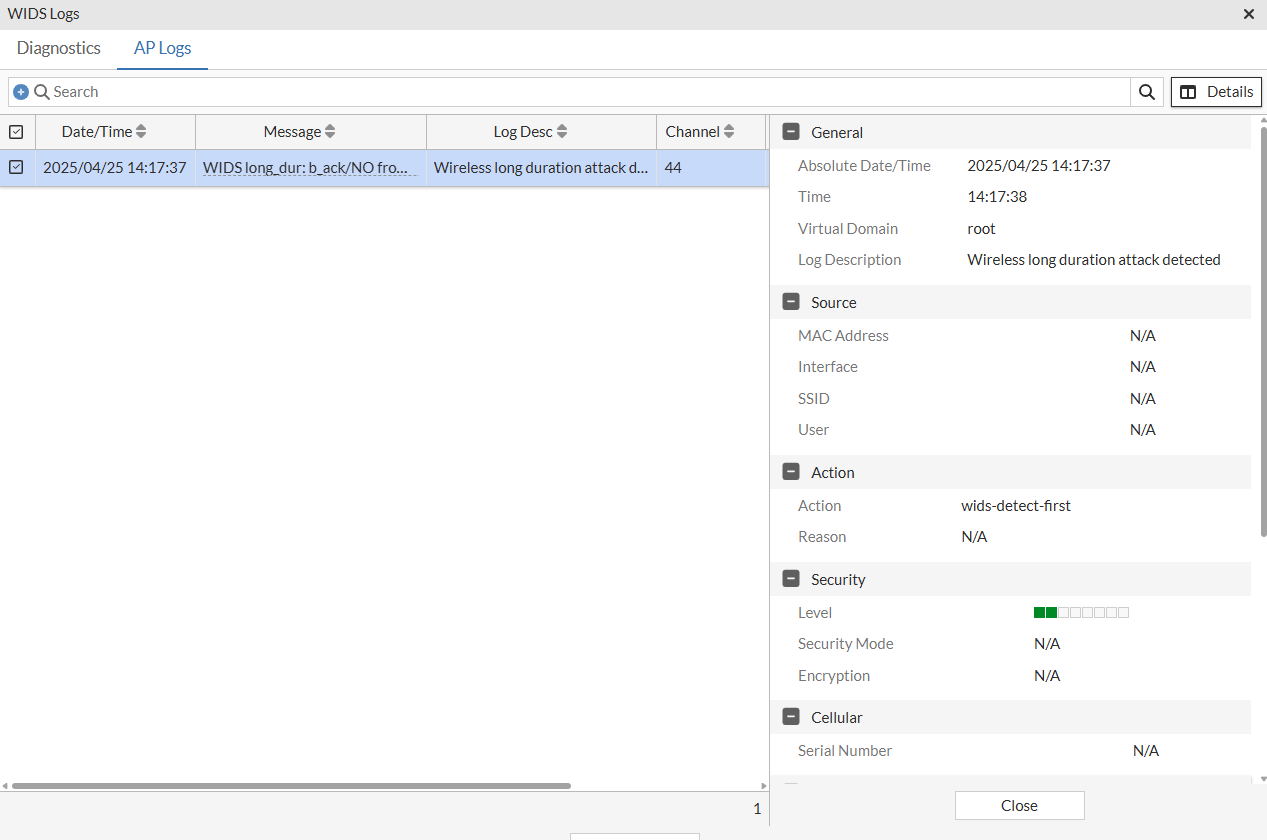
The AP Logs tab displays details of the event such as time of the event, error message and log of the event, and details of channel, BSSID, and Transmitter MAC address.
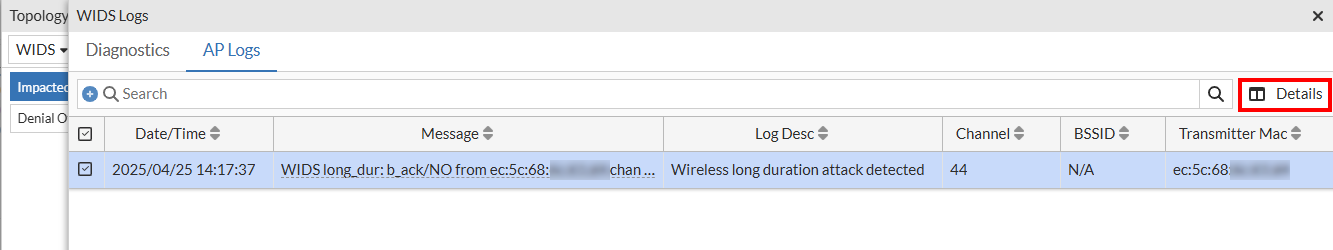
Select the log and click Details to view a more detailed log.
Note: WIDS must be enabled on FortiGate to detect wireless attacks and receive logs for the WIDS SLA. By default, intrusion detection in WIDS profile is disabled. For more information, see FortiWiFi and FortiAP Configuration Guide.
Rogue APs
This chart provides details of the rogue APs detected on the network.
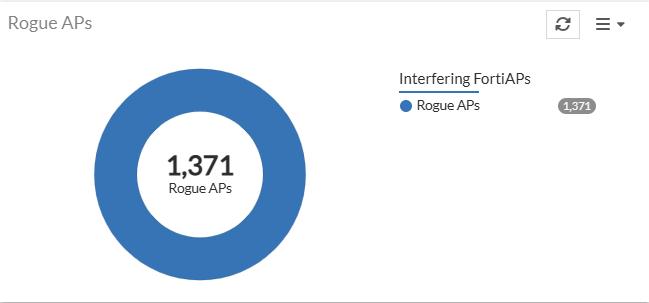
Click on the chart to view more details. For more information, see Rogue APs.
Applications by Usage
This chart provides details of the applications being used in the network along with the data being used by each application.
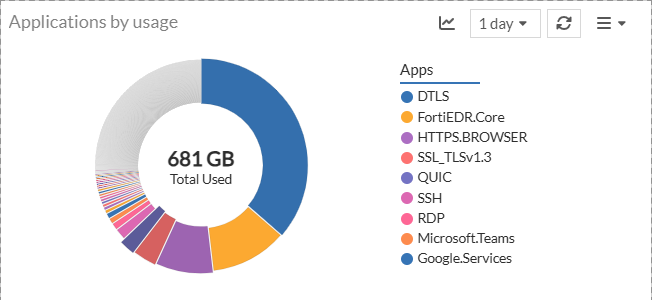
Click on an application name to view more details. For more information, see Applications.
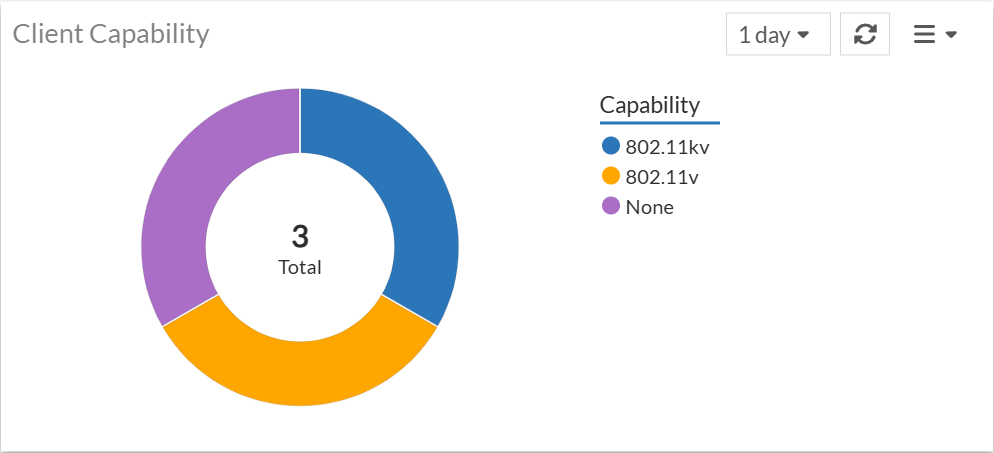
Client Capability
The Client Capability widget provides a quick and informative overview of the connection health of wireless clients over a specific time period. The widget represents the total number of clients connected during that time, categorized by their connection status or capabilities.
To add the widget, navigate to Dashboard > Wireless. Click Add Widget.
-
Total: The number in the center of the chart indicates the total number of clients that are connected during the specified time period.
-
Capability Legend: The legend on the right explains what each colour segment of the chart represents. The categories are based on various Wi-Fi protocol standards and capabilities, which are often related to roaming and connection optimization.
Clicking on a specific category displays the Station details window with more details.
The search bar and sorting options for each column allows a network administrator to quickly find and analyze specific station details.