
Switch
The Switch page displays all the important details about the switches within your network. Details of all the FortiSwitches and their status, the types of even in a specific time period, details of the wired clients, and different SLAs displayed.
The following charts are available:
FortiSwitches
This chart displays the total number of FortiSwitches in your network and their status (Online, Offine, Waiting for Authorization, or Unknown).
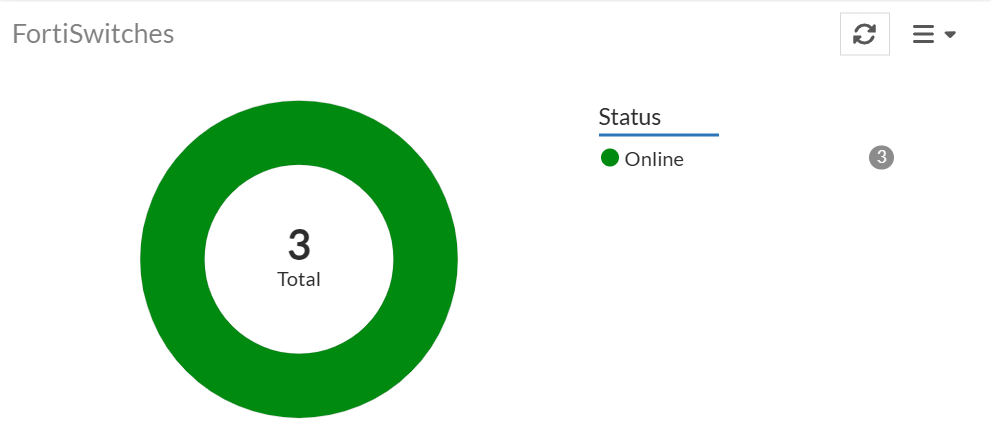
Click the chart for detailed information about the FortiSwitches.
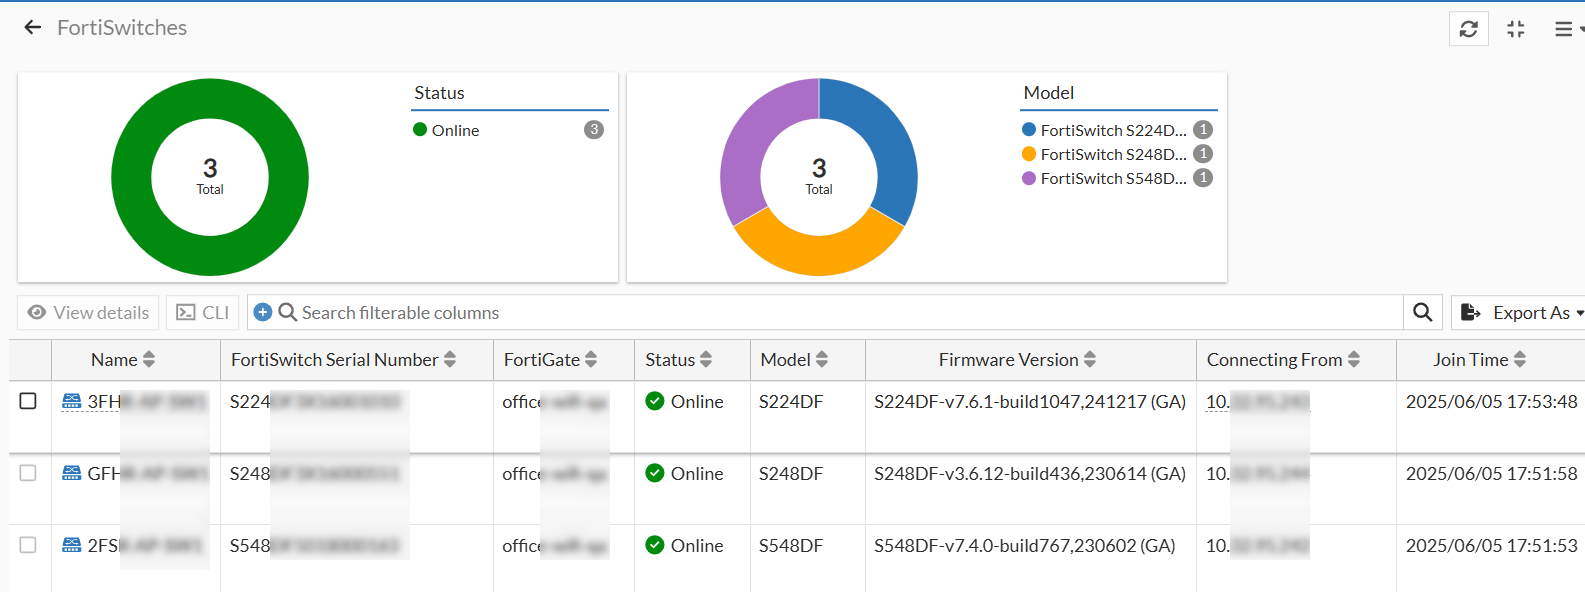
For more information, see FortiSwitch.
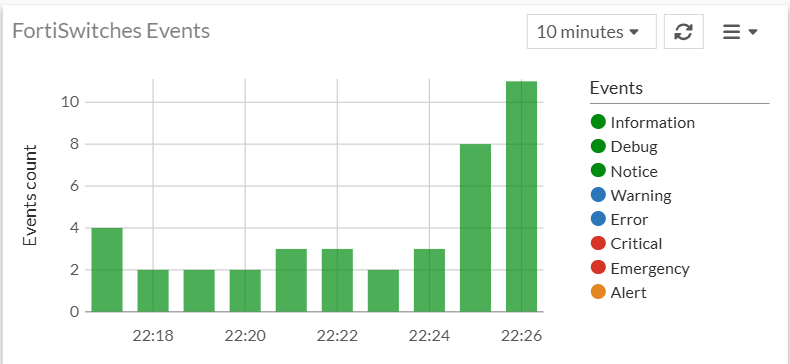
FortiSwitches Events
This chart displays the FortiSwitch events at a given time and categorizes them based on the type of event as Information, Debug, Notice, Warning, Error, Critical, Emergency, and Alert. You can select the period to view the data (10 or 30 minutes, 1 or 12 hours, or 1 day).
Wired Clients
This chart helps you to monitor the wired clients on your network.
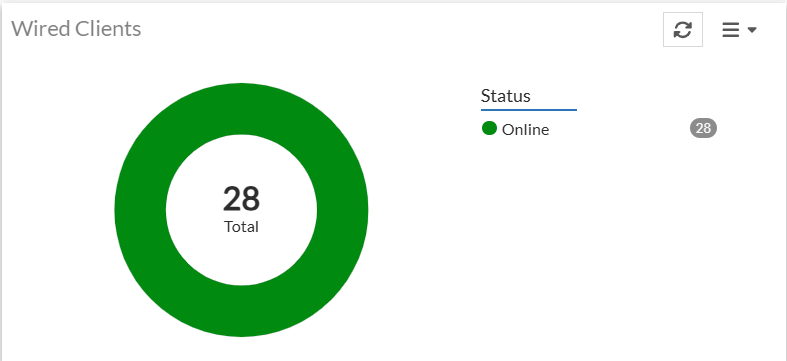
Click on the chart to view more details. For more information, see Wired Clients.
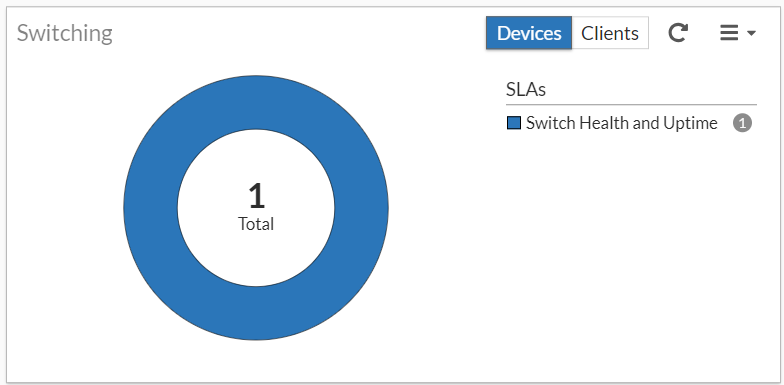
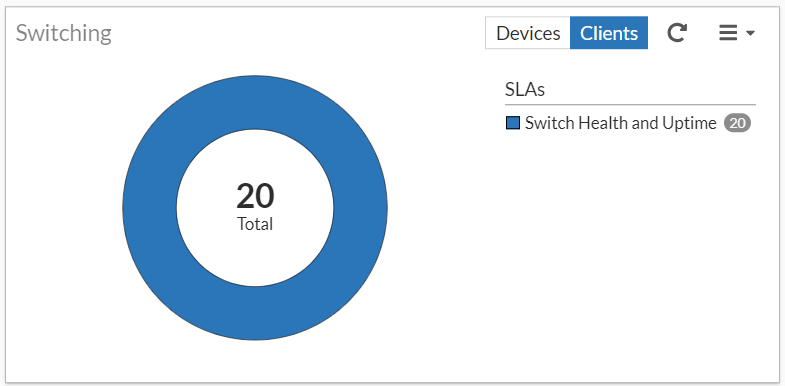
Switching Insights
The Switching Insights panel displays the total number of impacted clients and SLA data. Select Devices to view the impacted switch count or click Clients to view the impacted client count.
Notes:
-
Ensure that all L2 security features, such as, BPDU guard, loop guard, DHCP snooping, root guard are enabled on the switch port to detect STP and DHCP failures.
-
DHCP failures are reported only for DHCP configurations in the FortiSwitch, such as, DHCP client blocked, DHCP lease full.
The following SLAs are detected and reported by FortiAIOps for switching. The issues reported are categorized based on classifiers and sub-classifiers, with suggested remedial measures to curtail the SLA breaches and enhance network performance.
Displays potential low throughput conditions. The system uses intelligent machine learning to analyze recent switch port statistics by dynamically learning from recent data. Unusual patterns and potential breaches are identified with significantly improved accuracy.
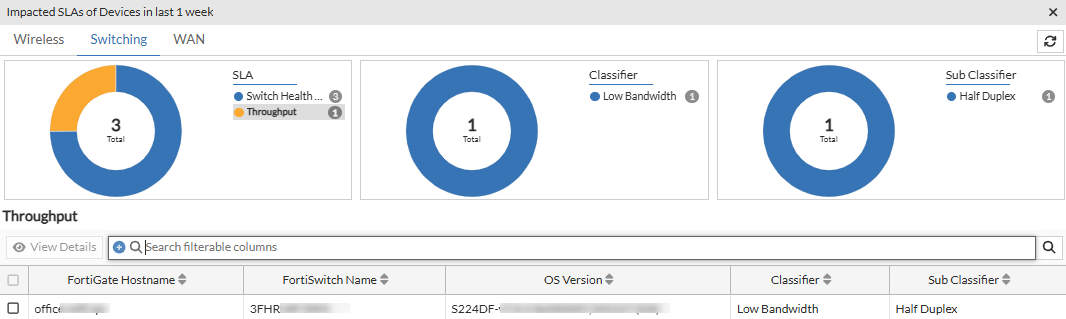
The Throughput table displays information such as the client MAC address, the associated FortiSwitch details, and port details for the reported classifiers and sub classifiers, issue description and the suggested remediation measure, and so on are displayed. Right-click on the header of the table to select the columns that you wish to view.
|
Attribute |
Description |
|---|---|
| MAC Address | The MAC address of the impacted client device. |
| FortiGate Hostname | The hostname of the FortiGate associated with the FortiSwitch/impacted client. |
| FortiSwitch Name | The name of the FortiSwitch that the impacted client associated with. |
| Classifier | The classifier of the issue reported for the SLA. |
| Sub Classifier | The sub-classifier of the issue for the reported classifier. |
| Connecting From | The IP address of the FortiSwitch. |
| FortiGate Serial Number | The serial number of the FortiGate associated with the FortiSwitch/impacted client. |
| FortiSwitch Serial Number | The serial number of the FortiSwitch associated with the FortiSwitch/impacted client. |
|
OS Version |
The OS version of the FortiSwitch. |
|
Port Name |
The FortiSwitch port details. |
|
Status |
The status of the FortiSwitch (online/offline). |
|
State |
The state of the FortiSwitch (authorized/unauthorized). |
Select a row and click View Details. The Details table displays the following information.
Right-click on the header of the table to select the columns that you wish to view.
|
Attribute |
Description |
|---|---|
| Date/Time | The date and time of the impact as per your timezone. |
| FortiSwitch Name | The name of the impacted switch. |
| Client MAC Address | The MAC address of the impacted client device. |
| Hostname | The name of the device as configured by the user. If the name is not configured or available, then MAC address is displayed. |
| Issue Cause List | Detailed cause of the SLA breach that impacted the client/switch. |
| Remedies | The suggested remedy to resolve the issue. |
| Classifier | The classifier of the issue reported for the SLA. |
| Sub Classifier | The sub-classifier of the issue for the reported classifier. |
|
FortiGate Hostname |
The hostname of the FortiGate associated with the impacted client. |
|
FortiGate Serial Number |
The serial number of the FortiGate associated with the impacted client. |
|
FortiSwitch Serial Number |
The serial number of the impacted switch. |
|
Port Name |
The FortiSwitch port details. |
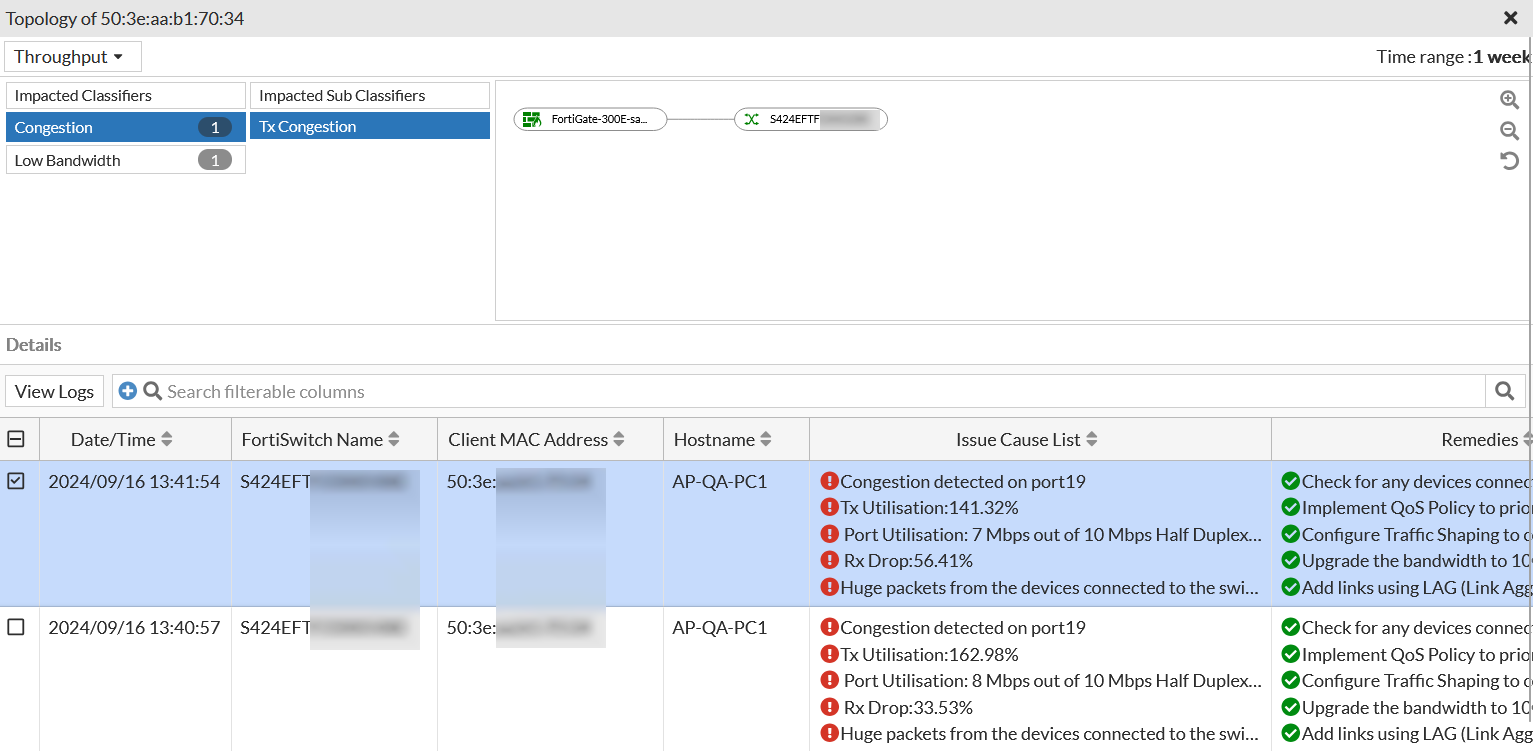
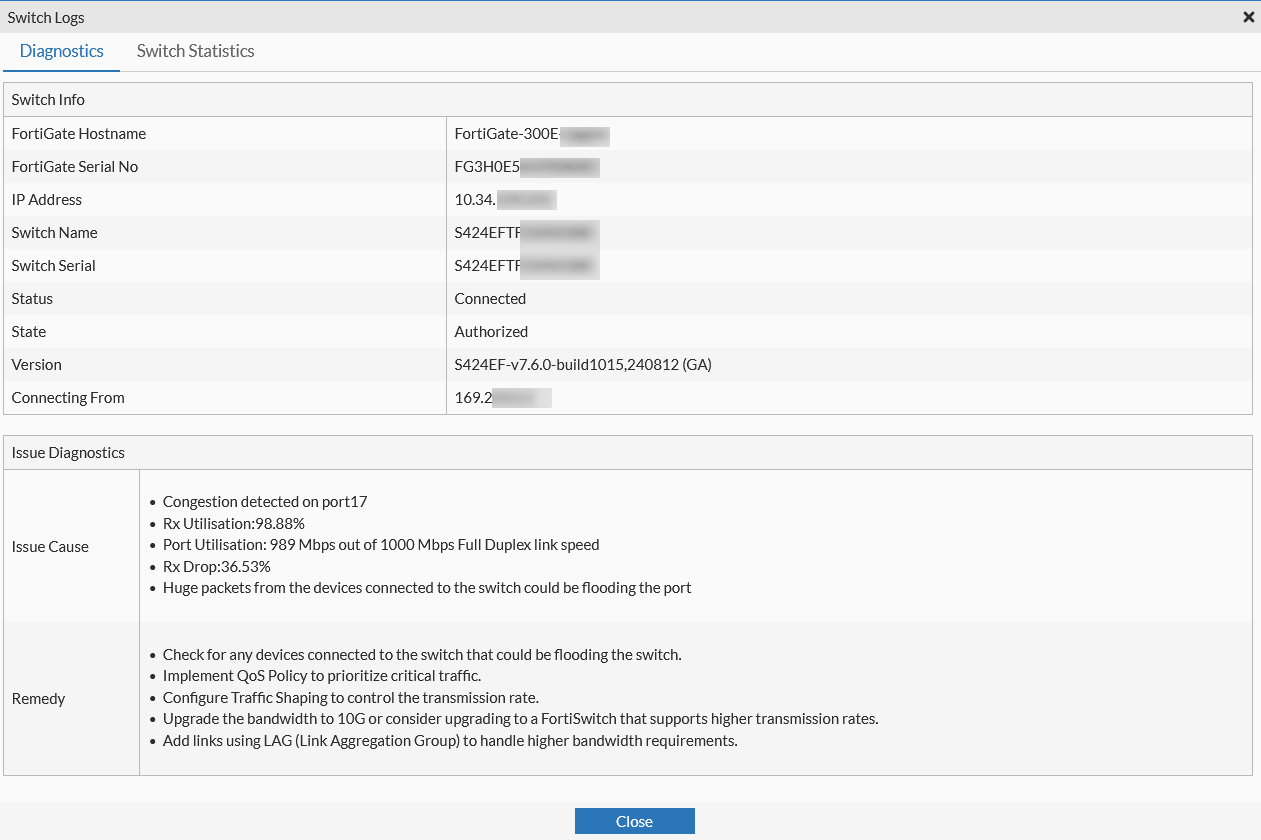
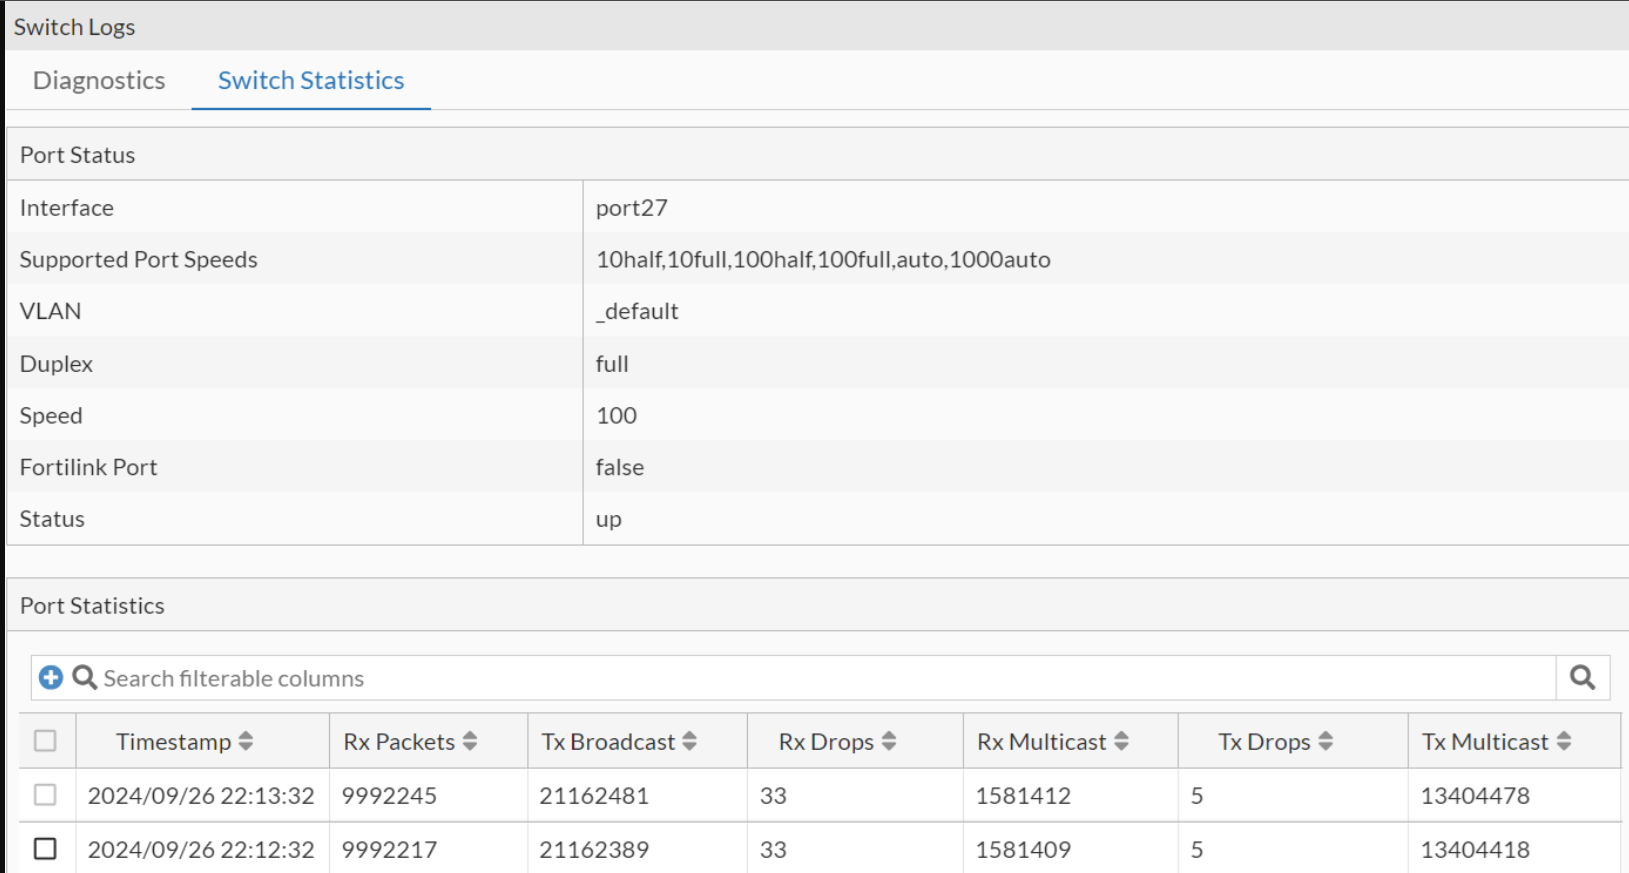
To view the Switch logs, select a specific row of a Throughput event and click View Logs. You can view Switch details and diagnostics with the issue description and the suggested remediation, along with the FortiSwitch port statistics.
Displays potential network disruptions that may lead to poor connectivity. Intelligent machine learning is used to analyze recent switch port statistics and learn from recent data, thus identifying unusual patterns and potentials threats.
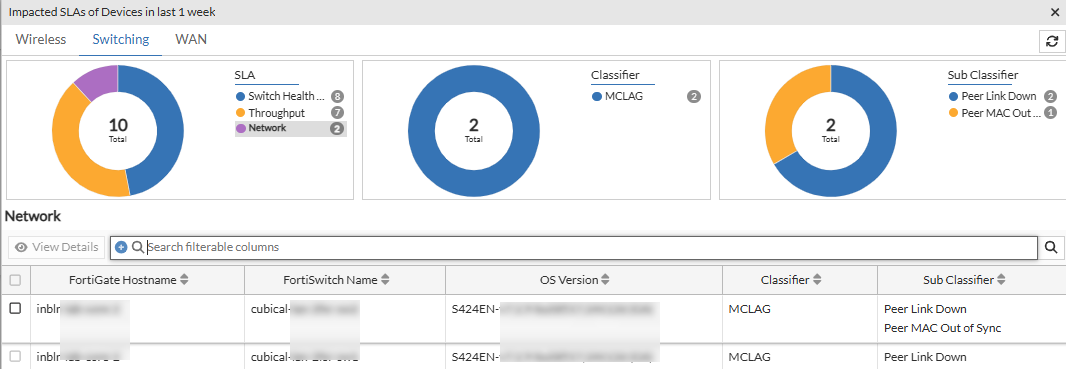
The Network table displays information such as the client MAC address and the associated FortiSwitch details for the reported classifiers and sub classifiers, issue description and the suggested remediation measure, and so on are displayed. Right-click on the header of the table to select the columns that you wish to view.
|
Attribute |
Description |
|---|---|
| MAC Address | The MAC address of the impacted client device. |
| FortiGate Hostname | The hostname of the FortiGate associated with the FortiSwitch/impacted client. |
| FortiSwitch Name | The name of the FortiSwitch that the impacted client associated with. |
| Classifier | The classifier of the issue reported for the SLA. |
| Sub Classifier | The sub-classifier of the issue for the reported classifier. |
| Connecting From | The IP address of the FortiSwitch. |
| FortiGate Serial Number | The serial number of the FortiGate associated with the FortiSwitch/impacted client. |
| FortiSwitch Serial Number | The serial number of the FortiSwitch associated with the FortiSwitch/impacted client. |
|
OS Version |
The OS version of the FortiSwitch. |
|
Port Name |
The FortiSwitch port details. |
|
Status |
The status of the FortiSwitch (online/offline). |
|
State |
The state of the FortiSwitch (authorized/unauthorized). |
Select a row and click View Details. The Details table displays the following information.
Right-click on the header of the table to select the columns that you wish to view.
|
Attribute |
Description |
|---|---|
| Date/Time | The date and time of the impact as per your timezone. |
| FortiSwitch Name | The name of the impacted switch. |
| Client MAC Address | The MAC address of the impacted client device. |
| Hostname | The name of the device as configured by the user. If the name is not configured or available, then MAC address is displayed. |
| Issue Cause List | Detailed cause of the SLA breach that impacted the client/switch. |
| Remedies | The suggested remedy to resolve the issue. |
| Classifier | The classifier of the issue reported for the SLA. |
| Sub Classifier | The sub-classifier of the issue for the reported classifier. |
|
FortiGate Hostname |
The hostname of the FortiGate associated with the impacted client. |
|
FortiGate Serial Number |
The serial number of the FortiGate associated with the impacted client. |
|
FortiSwitch Serial Number |
The serial number of the impacted switch. |
|
Port Name |
The FortiSwitch port details. |
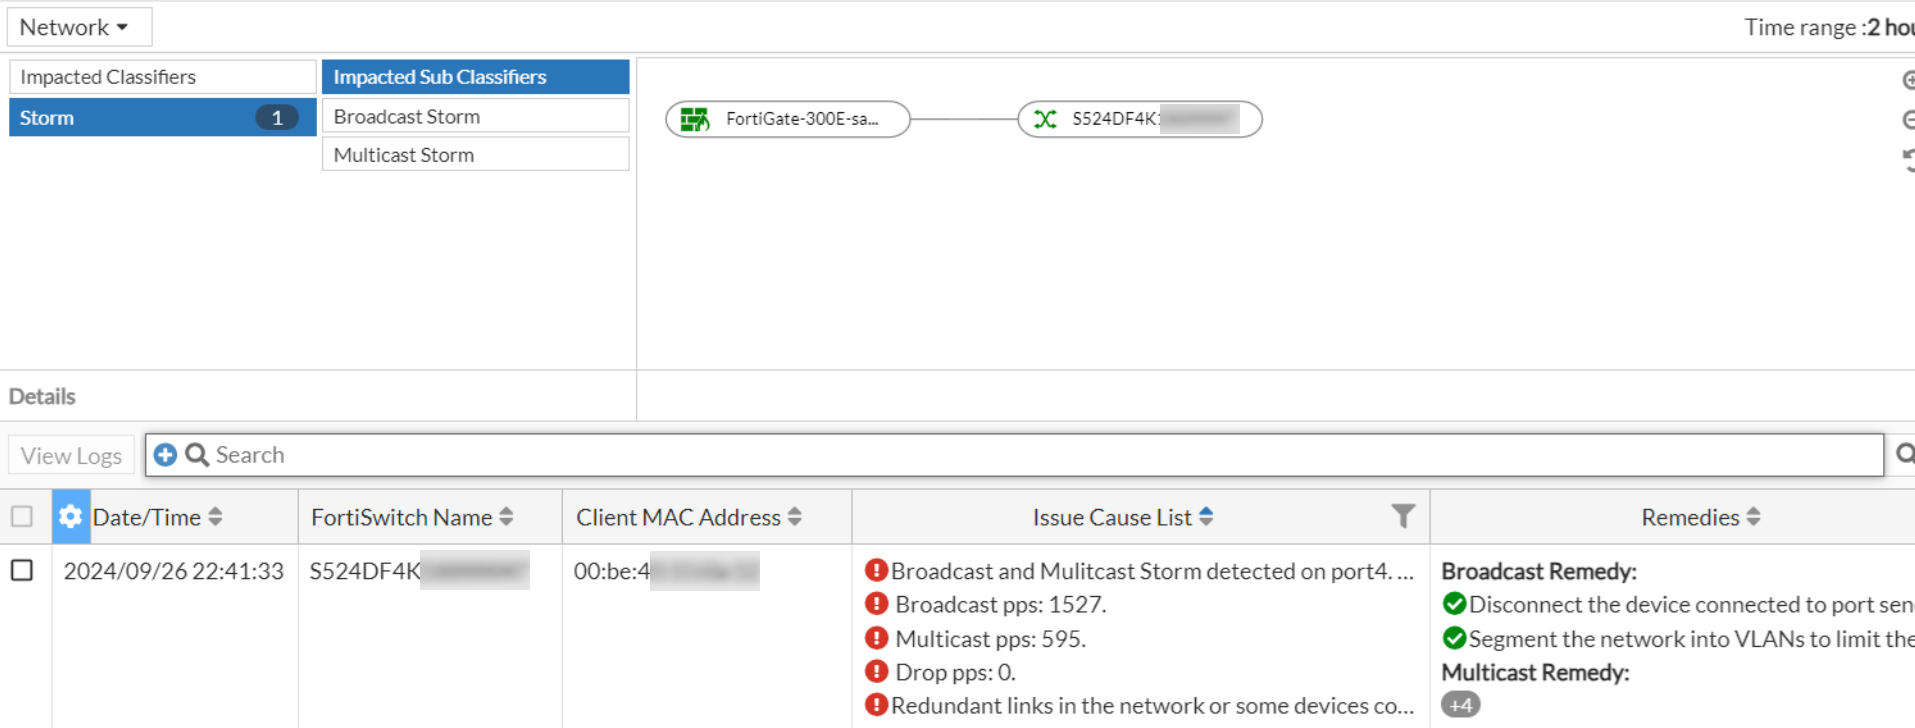
To view the Switch logs, select a specific row of Network SLA event and click View Logs. You can view Switch details and diagnostics with the issue description and the suggested remediation, along with the FortiSwitch port statistics.

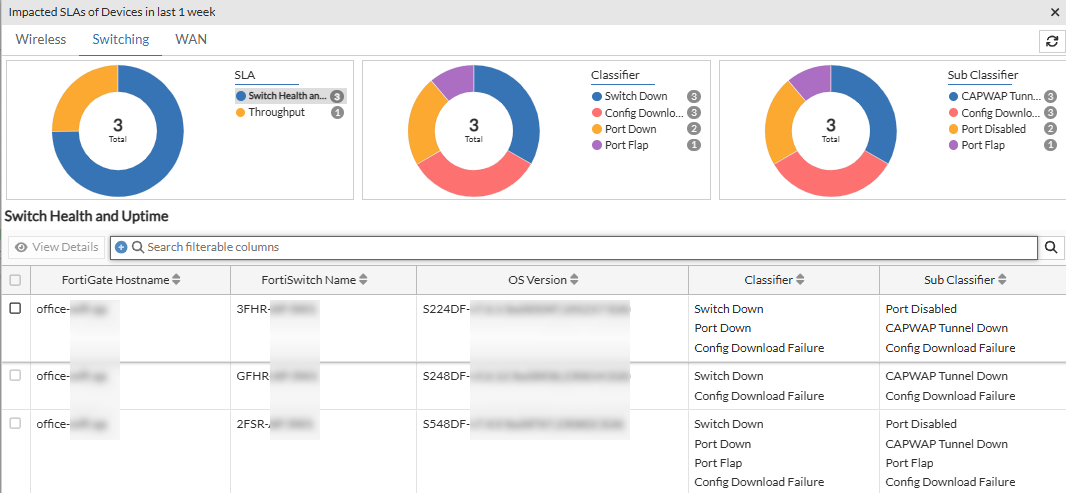
Displays the switch health based on the configured switch health threshold values and the status of the switch (Up/Down). The associated impacted FortiGate controller, switch, and client count are displayed in a collapsible topology. If you select the Devices view in the Switching panel and click on the SLA in the impacted SLAs list or click on the bar in the chart, the impacted switches' details such as, OS version, the associated FortiGate host name and serial number, FortiSwitch name and serial number, FortiSwitch state and status, and classifier and sub-classifier are displayed.
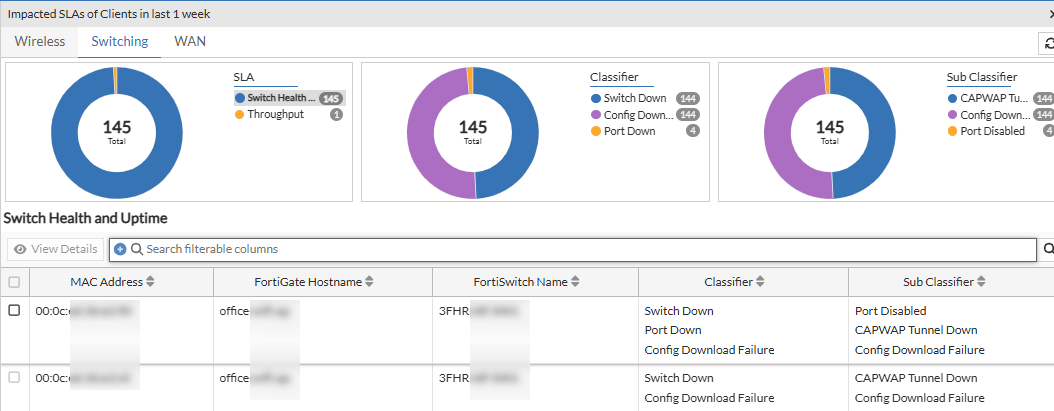
If you select the Clients view in the Switching panel and click on the SLA in the impacted SLAs list or click on the bar in the chart, the impacted client details, such as, MAC address, OS version, the associated FortiGate host name and serial number, FortiSwitch name and serial number, FortiSwitch state and status, and classifier and sub-classifier are displayed.
Select a row and click View Details. The Details table displays the following information.
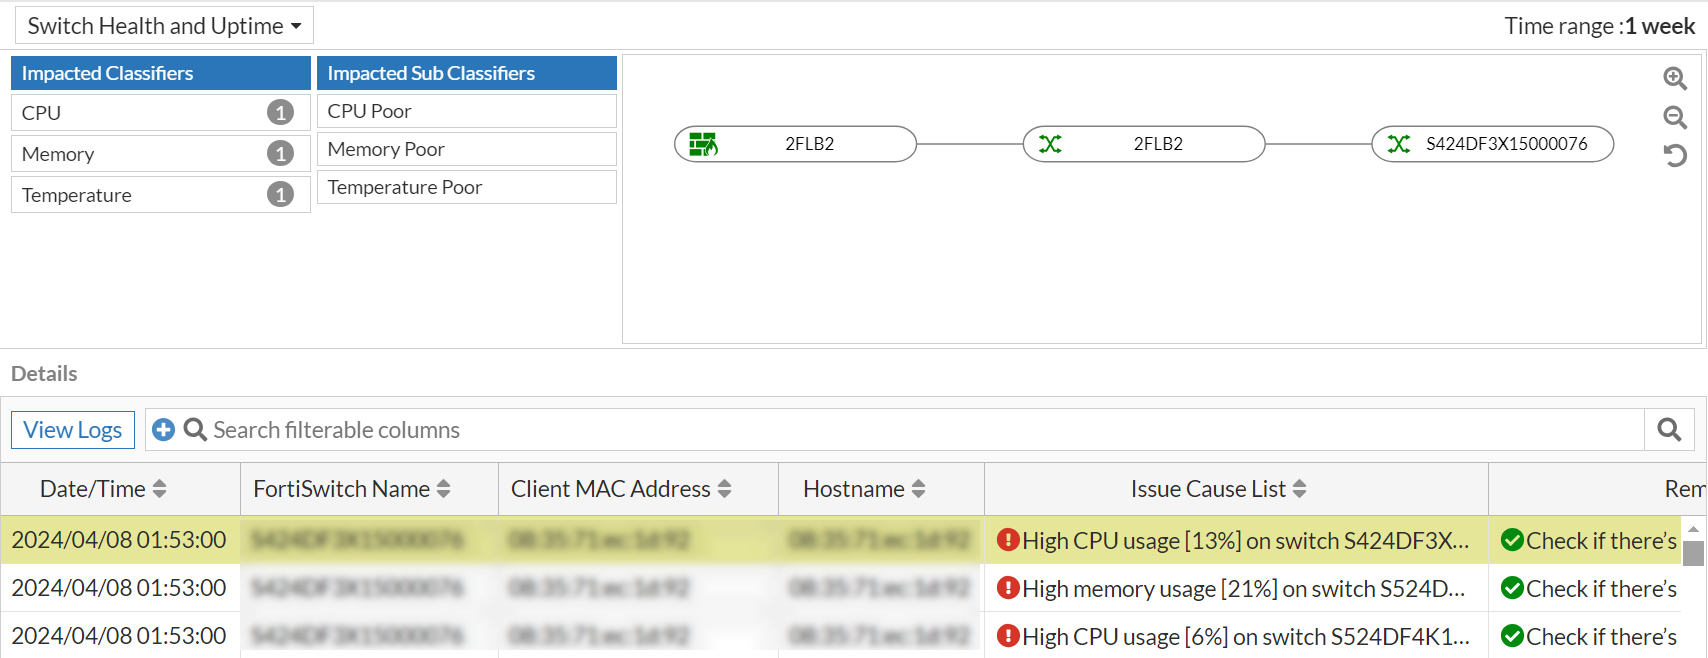
Right-click on the header of the table to select the following columns that you wish to view.
|
Attribute |
Description |
|---|---|
| Date/Time | The date and time of the impact as per your timezone. |
|
FortiSwitch Name |
The name of the impacted switch. |
| Client MAC Address | The MAC address of the impacted client device. |
| Hostname | The name of the device as configured by the user. If the name is not configured or available, then MAC address is displayed. |
| Issue Cause List | Detailed cause of the SLA breach that impacted the client/switch. |
| Remedies | The suggested remedy to resolve the issue. |
| Classifier | The classifier of the issue reported for the SLA. |
| Sub Classifier | The sub-classifier of the issue for the reported classifier. |
|
FortiGate Hostname |
The hostname of the FortiGate associated with the impacted client. |
|
FortiGate Serial Number |
The serial number of the FortiGate associated with the impacted client. |
|
FortiSwitch Serial Number |
The serial number of the impacted switch. |
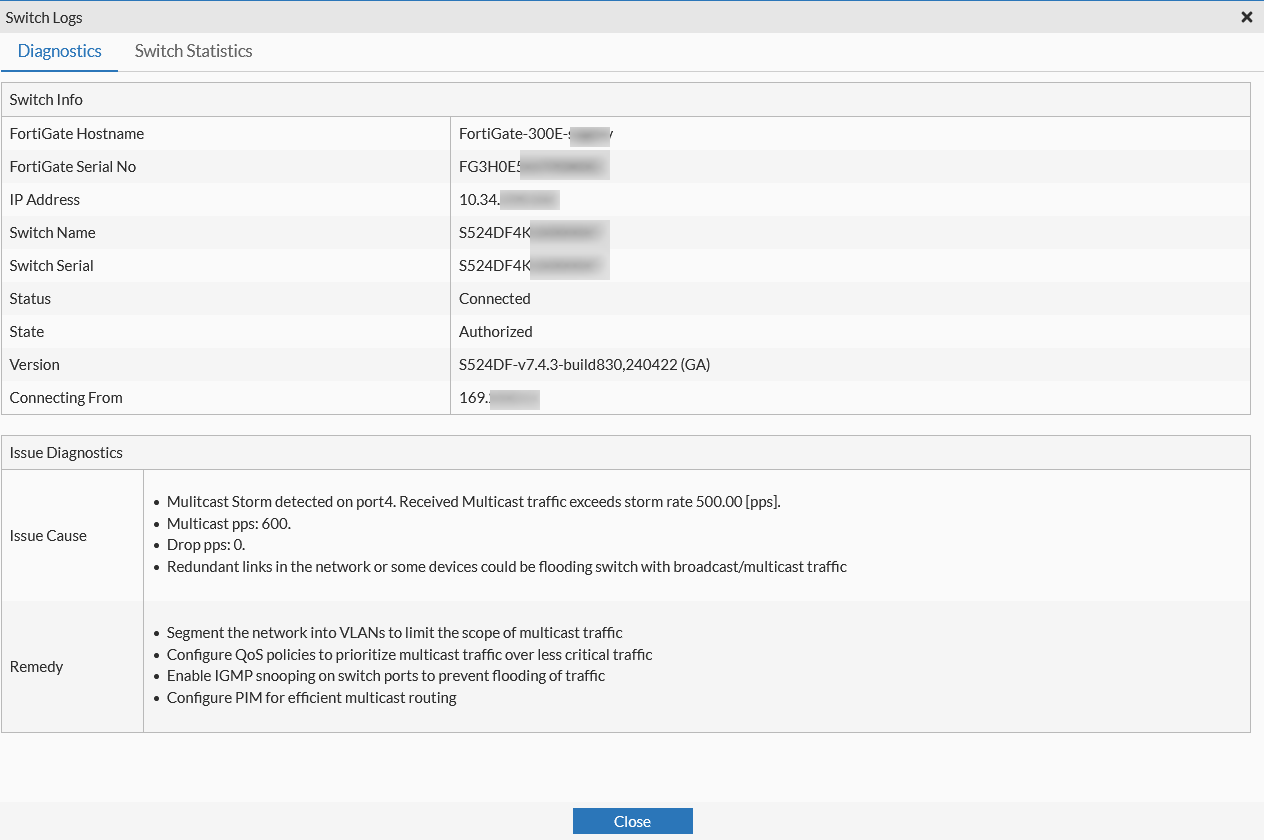
Select a particular switch and click View Logs, the issue diagnostics and the suggested remedy are displayed.
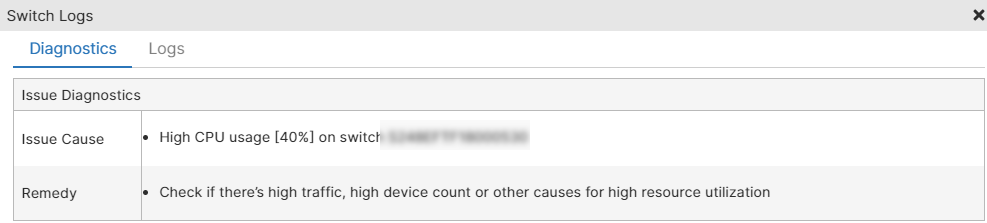
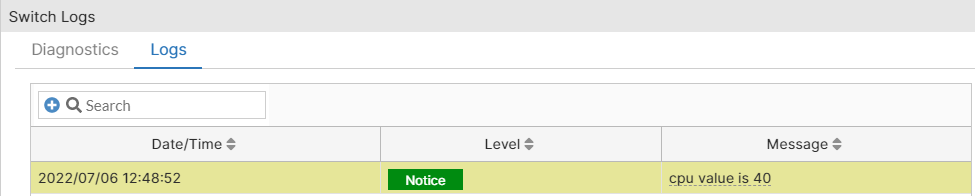
The Logs tab displays the time stamp of each action, the type of action such as notice, warning, etc., and the impact details are displayed. Different data tabs are displayed based on the selected issue/failure.
Note: The default value for the CPU and memory parameters is 80% and the default value for the temperature is 65 degree Celsius.
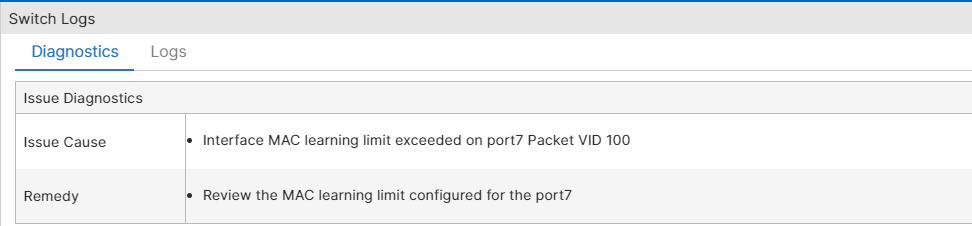
Displays the failed/unsuccessful client connections based on authentication events such as MAC authentication and 801x authentication and MAC learning limit.
Select a row and click View Details. The Details table displays the following information.
Right-click on the header of the table to select the columns that you wish to view.
|
Attribute |
Description |
|---|---|
| Date/Time | The date and time of the impact as per your timezone. |
|
FortiSwitch Name |
The name of the impacted switch. |
| Client MAC Address | The MAC address of the impacted client device. |
| Hostname | The name of the device as configured by the user. If the name is not configured or available, then MAC address is displayed. |
| Issue Cause List | Detailed cause of the SLA breach that impacted the client/switch. |
| Remedies | The suggested remedy to resolve the issue. |
| Classifier | The classifier of the issue reported for the SLA. |
| Sub Classifier | The sub-classifier of the issue for the reported classifier. |
|
FortiGate Hostname |
The hostname of the FortiGate associated with the impacted client. |
|
FortiGate Serial Number |
The serial number of the FortiGate associated with the impacted client. |
|
FortiSwitch Serial Number |
The serial number of the impacted switch. |
Select a particular switch and click View Logs, the issue diagnostics and the suggested remedy are displayed.
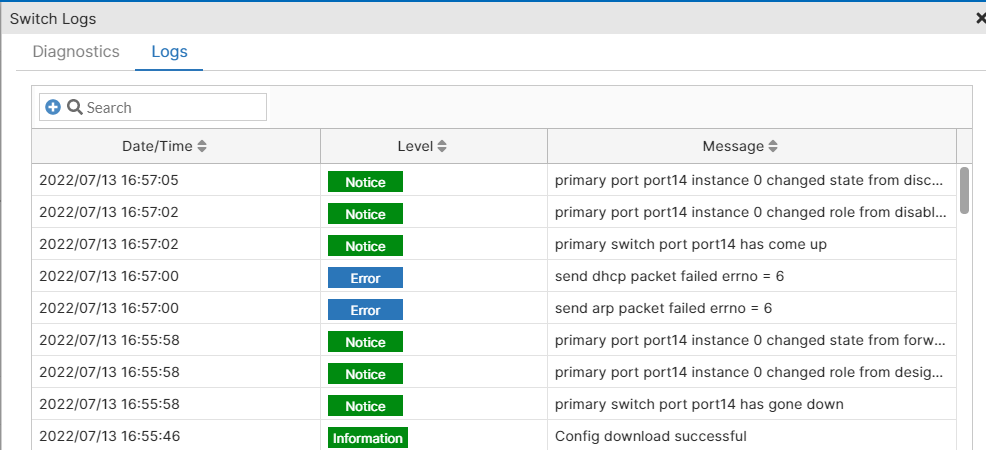
The Logs tab displays the time stamp of each action, the type of action such as notice, warning, etc., and the impact details are displayed. Different data tabs are displayed based on the selected issue/failure.
Note: In the Switch Logs > Diagnostics tab, if the remedy contains the phrase cable test, a Run Cable Test button is displayed, to initiate a cable test on the affected port. For more information, see Cable Testing section in FortiSwitch.