
What's new
The following sections describe new features, enhancements, and changes:
- Support for shared traffic shapers and per-IP traffic shapers
- View license usage history
- Set size limit of ICAP server scan
- Support for forwarding domains in transparent mode
- Enhancement to forward server monitoring
- Diagnose transceivers of an interface
- Support for webfilter strict search and safe search level on Qwant
Support for shared traffic shapers and per-IP traffic shapers
You can now use shared traffic shapers in a firewall shaping policy to indicate the priority and guaranteed and maximum bandwidth for a specified type of traffic use.
You can also use per-IP traffic shapers to limit each IP address's behavior to avoid a situation where one user uses all of the available bandwidth. In addition to controlling the maximum bandwidth used per IP address, you can also define the maximum number of concurrent sessions for an IP address.
To configure shared traffic shapers or per-IP traffic shapers:
- Create a firewall policy under Policy and Objects >> Policy. Alternatively, use the
config firewall policycommand to create the firewall policy. - Create the shared traffic shapers or per-IP traffic shapers in the Traffic Shapers tab under Policy >> Traffic Shaping. Alternatively, use the
config firewall shaper traffic-shapercommand to create the shared traffic shapers or use theconfig firewall shaper per-ip-shapercommand to create the per-IP traffic shapers. - In the Traffic Shaping Policies tab under Policy >> Traffic Shaping, create a firewall shaping policy that uses the traffic shapers you created in step 2. Alternatively, use the
config firewall shaping-policycommand to create the firewall shaping policy.
To diagnose shared traffic shapers, use the following commands:
-
# dia fire shaper traffic-shaper list
name shape
maximum-bandwidth 25000000 bytes/sec
guaranteed-bandwidth 12500000 bytes/sec
current-bandwidth 0 bytes/sec
priority 2
overhead 0
tos ff
packets dropped 0
bytes dropped 0
-
# dia fire shaper traffic-shaper stats
shapers 1 ipv4 0 ipv6 0 drops 0 dropped bytes 0
To diagnose per-IP traffic shapers, use the following commands:
-
# dia firewall shaper per-ip-shaper list
name 1
maximum-bandwidth 375 bytes/sec
maximum-concurrent-session 0
tos 07/03
packets dropped 0
bytes dropped 0
addr=192.168.122.180 status: bytes/sec=0 ses=2
-
# dia firewall shaper per-ip-shaper stats
memory allocated 2 packet dropped: 0
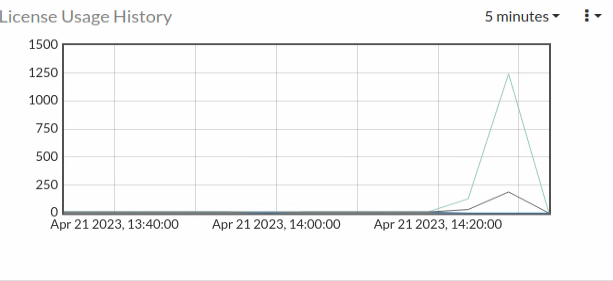
View license usage history
Use the new License Usage History widget to view license usage history for shared licenses at a certain interval. Configure the interval at the top-right corner with the following options: 15 seconds, 5 minutes, 1 hour, 1 day, 1 week, 1 month, or 1 year. For each timestamp, the widget displays the following values:
-
Min Usage—Minimum number of license seats used during the past interval.
-
Max Usage—Maximum number of license seats used during the past interval.
-
Average Usage—Average number of license seats used during the past interval.
Alternatively, use the following diagnose command to show license usage in the CLI:
wad license usage [seconds | minutes | hour | day | week | year]
To manipulate the license usage data for testing purposes:
You can insert a data set entry to the past 15 seconds using the following command:
diag wad license test [value] [number of entries]
For example, diag wad license test 20 1 means adding one entry of the data set [min=20, max=20, average=20] to the license usage data of the past 15 seconds.
To clear all license usage history data:
diag wad license clear
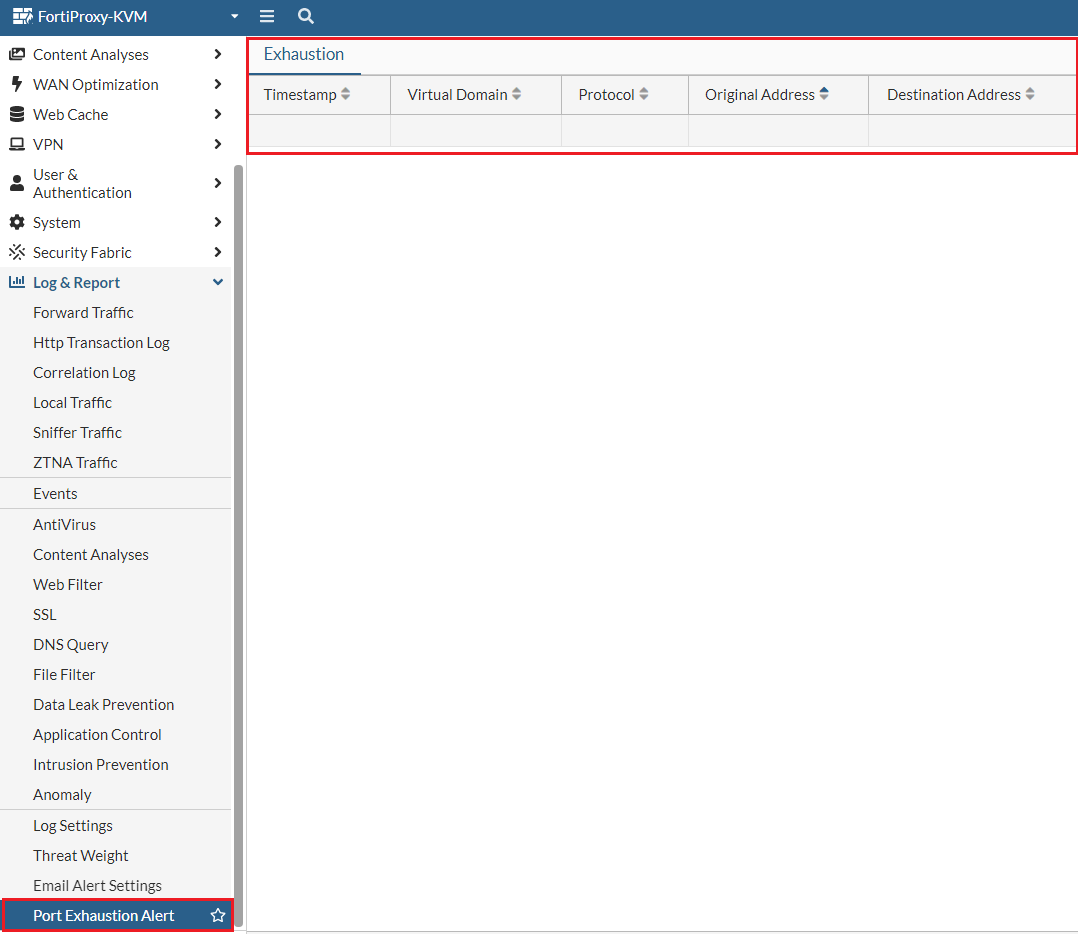
Port exhaustion alerts in GUI
Under Log & Report, use the new Port Exhaustion Alert tab to view port exhaustion events with timestamp, virtual domain, protocol, and address information of the exhaustion. When a port exhaustion occurs, an alert appears next to Log & Report and Port Exhaustion Alert until the event expires.
Set size limit of ICAP server scan
When creating or editing an ICAP profile under Content Analysis >> ICAP Profile, you can now specify the ICAP server scan size limit for a single request within the range of 0-4096 (MB). The default is 0 MB, which means unlimited.
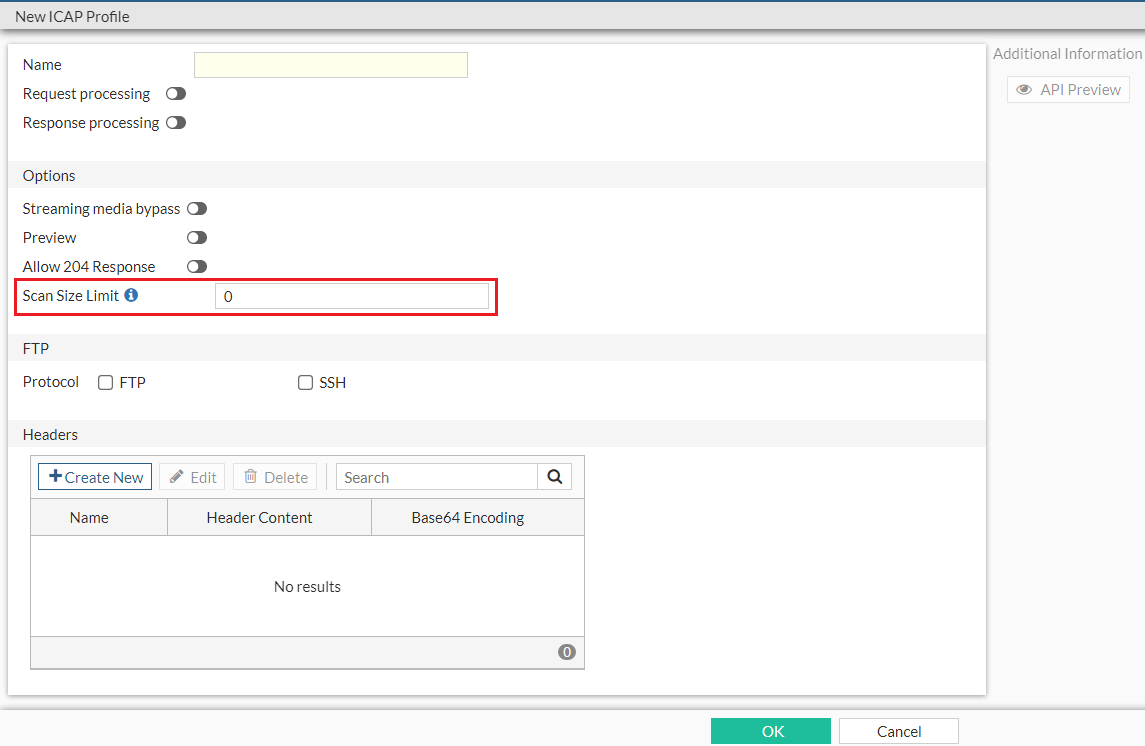
Alternatively, in the CLI, use the set scan-size-limit {integer} option under the config icap profile command to set the ICAP server scan size limit. You can further configure whether to generate an ICAP log for bypassed oversize events using the set scan-oversize-log [disable|enable] option.
Support for forwarding domains in transparent mode
A forwarding domain is used to create separate broadcast domains and confine traffic across two or more ports. It also allows learning the same MAC in different VLANs (IVL).
-
Use the
set forward-domainoption underconfig system settingsto enable or disable forwarding domains. -
Use the
set forward-domainoption underconfig system interfaceto configure the transparent mode forward domain. This option accepts integers within the range 1-4094.
Enhancement to forward server monitoring
The Forward Server Monitor widget in Dashboard includes several enhancements:

-
The Status column is renamed Forward. Forward servers with Health Check disabled will always be Up in the Forward column. When such a forward server is part of a server group, it serves as a backup option when no other server is up and running.
-
The new State column is added to provide more specific state information about the forward server. The following states are available:
-
pending—Initial state of all forward servers. A pending forward server can mean one of the following:
-
The state of the forward server is unknown, which means no connection has been established yet or the state has not been updated yet.
-
The forward server is running but pending FQDN resolve. FQDN resolve failure triggers a state change to down.
-
-
try_once—For forward servers in down state with Health Monitor disabled, FortiProxy periodically switches its state from down to try_once to verify the latest status of the server to avoid situations where a server in down state is ignored in all subsequent health state checks.
-
busy—The forward server is running but unstable.
-
down—The forward server is not running and connections are blocked.
-
In the CLI, the following enhancements are applied to forward server monitoring:
-
New diagnose command
diag wad webproxy forward-server detailto display the state of each worker. -
New diagnose commands
diag debug enanddiag wad webproxy forward-server arbiterto display the following information:-
All forward servers known by the arbiter.
-
Last time when the status of each server was evaluated.
-
Status of each server.
-
-
The
diag wad webproxy forward-servercommand now displays the following additional information:-
Number of successful, failed, ongoing, and total traffic through the forward server.
-
Number of blocked connection by that specific forward server.
-
-
The
diag wad webproxy forward-server-groupcommand now displays the following additional information:-
Number of blocked connections.
-
Number of workers that load the forward server into memory.
-
Diagnose transceivers of an interface
Under Network >> Interfaces, for models that support transceivers, the Transceiver(s) column is available which shows information about transceivers plugged into the FortiProxy, including the vendor name and part number. You can hover over the transceiver to view additional information, such as the type, serial number, and port name.
Alternatively, use the new get system interface transceiver <interface name> command to diagnose interface transceivers. Interface name must be one of the following:
-
port3
-
port4
-
port7
-
port8
Example output:
fortiproxy1-nh # get sys interface transceiver port3
Interface port3 - Transceiver is not detected.
fortiproxy1-nh # get sys interface transceiver
Interface port3 - Transceiver is not detected.
Interface port4 - Transceiver is not detected.
Interface port7 - Transceiver is not detected.
Interface port8 - SFP/SFP+ (10.3G)
Vendor Name : AVAGO
Part No. : AFBR-709ASMZ
Serial No. : AA14393JMGU
Optical Optical Optical
SFP/SFP+ Temperature Voltage Tx Bias Tx Power Rx Power
Interface (Celsius) (Volts) (mA) (dBm) (dBm)
------------ ------------ ------------ ------------ ------------ ------------
port8 29.1 3.34 5.44 -2.3 -6.1
++ : high alarm, + : high warning, - : low warning, -- : low alarm, ? : suspect.
Support for webfilter strict search and safe search level on Qwant
- The
config webfilter search-enginecommand now supports Qwant. - Under
config webfilter profile, use the newset qwant-restrictoption to configure the Qwant safe search level.
Add local URL list as data source for firewall
To add local URL list as data source for firewall via CLI:
- Define the local URL list in web filter:
config webfilter url-list
edit <name>
set uuid {uuid}
set status [enable|disable]
set comment {var-string}
config entries
edit <url>
next
end
next
end
- Configure the
firewall proxy or the to use the local URL list:
config firewall proxy-address
edit <name>
set type url-list
set url-list <External or webfilter URL list>
next
end
- You can also use the URL list as the source of servers to exempt from SSL inspection under
config firewall ssl-ssh-profile:config ssl-exempt
edit <id>
set type [fortiguard-category|address|...]
set fortiguard-category {integer}
set address {string}
set address6 {string}
set wildcard-fqdn {string}
set regex {string}
set finger-print-category [unknown|firefox|...]
next
end
- To reference the local URL list as data source of firewall, use the
firewall.policy.dstaddrcommand.
Changes to config firewall ssl-server command
Under config firewall ssl-server, the default value of the ssl-server cert option is changed from Fortinet_CA_SSL to Fortinet SSL cert.
Changes to config firewall ssl-ssh-profile command
Under config firewall ssl-ssh-profile, when the value of set status [disable|certificate-inspection|...] is disable or certificate-inspection, the min-allowed-ssl-version option is skipped.
Remove Unicast Heartbeat option in HA Config-Sync mode
The Unicast Heartbeat option is no longer available if the Config-Sync mode is selected when you create or edit an HA cluster.
Remove set auth-timeout option for user setting commands
The set auth-timeout option, which is used to configure the time period (in minutes) before the firewall user needs to reauthenticate, is no longer available in the following user setting commands:
Remove cifs-profile option from config firewall policy
The cifs-profile option is no longer available under config firewall policy. To configure cifs profile, use the config cifs command under config firewall profile-protocol-options instead.