
HA Troubleshooting
Effective troubleshooting of HA configurations is crucial for ensuring high availability and minimizing downtime. This section provides key strategies and techniques for diagnosing and resolving common issues in HA deployments.
This section covers the following troubleshooting topics:
Common Issues in HA Deployments
HA Event Log
HA Debug
Common Issues in HA Deployments
HA Management Interface
In HA-AP mode, direct access to the Secondary device is not possible unless management access has been explicitly enabled. If management access is not configured, you can only access the Secondary device’s CLI from the Primary device using the command: execute ha manage. To avoid this limitation, it is recommended to enable the Management Interface for all nodes.
To configure the management interface, use the mgmt-interface option under the config system ha command.
When configuring the management interface, ensure that the IP address is not in the same subnet as the original port1 or mgmt interface to avoid conflicts. It is advisable to have console access during this process. First, clear the old management IP address from the original interface (typically port1 or mgmt), and then configure it under config system ha.
For example:
FAD2 # config system ha
FAD2 (ha) # set mgmt-status enable
FAD2 (ha) # set mgmt-interface port1
FAD2 (ha) # set mgmt-ip 10.106.188.42/23
FAD2 (ha) # set mgmt-ip-allowaccess http https ping snmp ssh telnet
FAD2 (ha) # end
Configure the default route accordingly.
In HA-AA and HA-VRRP modes, configuring the HA Management Interface is not necessary. In HA-AA mode, each device uses the IP address associated with its own local ID. In HA-VRRP mode, interfaces retain their individual IP addresses, as interface addresses are not synchronized across devices.
HA Configuration Synchronization Issues
Once HA peers are established, all required configurations should be synchronized from the Configuration Source. Two types of synchronization occur: incremental synchronization and full synchronization. Incremental synchronization happens whenever a configuration change is made on one of the HA nodes, propagating the changes to the other peers. Full synchronization occurs when a new HA peer with a different configuration joins the cluster or when the command execute ha force sync-config is executed.
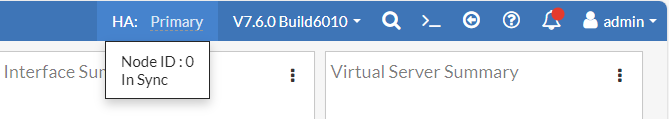
Under normal circumstances, from the GUI, you should see In Sync when you hover your cursor over the HA device from the top navigation, indicating that the configurations are aligned.
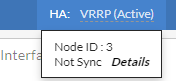
However, if an unexpected issue causes a configuration mismatch, the status may indicate an out-of-sync condition. In such cases, you can click Details to view a line-by-line comparison of the your current out-of-sync HA configuration against configuration of the device designated as the configuration source. You can manually correct the discrepancies on each device or run the execute ha force sync-config command on the device with the correct configuration to perform a full synchronization across the HA cluster.
If manually correcting discrepancies or forcing synchronization with the execute ha force sync-config command does not resolve the issue, you should back up the full configuration file from the correctly configured HA peer and restore it to the out-of-sync peer.
HA Abnormal State
If you encounter an abnormal HA state, such as dual Primary nodes or prolonged synchronization delays, begin by checking for errors using the get system ha-status command and reviewing the system event log.
The get system ha-status command provides an overview of the HA node's status and can reveal potential issues such as duplicate licenses or HA version mismatches. If an error persists, the relevant error count will increase each time you run get system ha-status.
For optimal operation, heartbeat and data ports should be directly connected or, at a minimum, placed within the same VLAN via switches. When configuring multiple heartbeat or data ports, ensure that each pair resides in a separate VLAN. If the connections are correct and the issue persists, enable debugging to diagnose the root cause of the abnormal HA state.
For example:
You can enable the "heartbeat" debug option to verify whether heartbeat messages are being sent and received successfully. If all heartbeat messages are properly transmitted and received, proceed by enabling the "errors" debug option to check for any errors. Record any errors that appear and work to resolve them.
In some cases, HA packet delays due to network conditions can cause HA timeouts, even when ports are correctly configured and connected. To mitigate this, consider increasing the hb-lost-threshold or hb-interval settings in config system ha.
For further details about using HA debug options, see HA Debug.
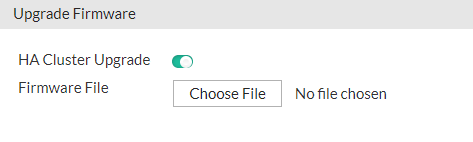
Firmware Upgrade in HA Cluster
Users can upgrade all FortiADC units within the HA cluster with a single click by enabling the HA Cluster Upgrade option in the Upgrade Firmware GUI.
For details, see Updating firmware for an HA cluster.
Remote IP Monitor in HA-AP
The Remote IP Monitor condition is a key factor in the election process when appliances join an HA cluster and determine the Primary node. If devices have identical disk states and monitor interface statuses, the appliance with the fewest failed Remote IP Monitor health checks will be elected as the Primary. At this stage, the Remote IP Monitor failover threshold does not influence the election.
Once an appliance assumes the role of HA-AP Secondary, it no longer processes traffic. Therefore, as long as the current Primary's count of failed Remote IP Monitor checks remains below the failover threshold, changes in the failure count will not trigger a failover.
A failover occurs when the current Primary's failed Remote IP Monitor count exceeds the failover threshold. In this case, one of the Secondary appliances will become the new Primary since all Secondary appliances are considered to have a zero failure count while inactive. Once a Secondary appliance becomes Primary, its Remote IP Monitor checks become active, potentially triggering another failover if its failover threshold is exceeded. If all appliances exceed the failover threshold, continuous failovers could occur. The Failover Hold Time setting determines how long an appliance retains its previous HA state in such scenarios to prevent excessive failover frequency.
HA Event Log
Event logs for all modules are accessible via the GUI under Log & Report > Event Log. In the event of HA issues, it is critical to review these logs for any relevant failure events.
The configuration event log is essential for tracking configuration changes on the FortiADC. It logs timestamps for both direct configurations made via the GUI or CLI and incremental synchronizations received from HA peers. When an incremental synchronization completes successfully, the event is logged across all HA members' configuration event logs. On the originating FortiADC, it appears as a direct CLI or GUI change, while on other FortiADC units, it is recorded as an HA synchronization event.
The system event log provides key insights into system-level operations, such as HA state transitions and the initiation of full synchronizations. It also captures indirect factors that could impact HA performance, such as the failure of a heartbeat interface, which may trigger a failover.
For more detailed, real-time HA logs, refer to HA Debug.
HA Debug
Logs generated by diagnose debug CLI commands are output in real-time to the console after debugging is enabled. Since each node in an HA cluster operates as an individual entity, their debug logs will not be identical. To effectively diagnose HA communication issues within the cluster, it is recommended to enable HA debug commands on all nodes in the HA cluster.
To enable HA debug:
-
Enable the system debug via
diagnose debugcommand.(M) FAD1 # diagnose debug enable
-
To output specific traffic flows, specify the number of debug lines required. Certain HA diagnose debug commands necessitate this configuration to activate flow-related debug log output.
Start debugging. The[<count>]option specifies the number of debug lines to output.(M) FAD1 # diagnose debug flow start [<count>]

To enable detailed debugging for specific traffic flows within the HA cluster, use the
diagnose debug flow startcommand with the relevantdiagnose debugcommands listed below.The following
diagnose debugcommands require thediagnose debug flow startcommand to be specified to generate output:diagnose debug ha heartbeat— outputs debug information for HA heartbeat messages.diagnose debug ha arp— outputs ARP-related debug logs within the HA cluster.diagnose debug ha layer4— captures Layer 4 debug logs for HA-related traffic.
The following
diagnose debugcommands can include flow-related information whendiagnose debug flow startis specified:diagnose debug ha basic— provides basic HA debug information, including flow details.diagnose debug ha error— outputs error-specific debug logs, potentially containing flow information.
For more information, see the FortiADC CLI Reference on diagnose debug flow and diagnose debug ha.
-
Toggle the appropriate HA debug options on or off as needed to suit your diagnostic requirements.
In the example below, we will enable debugging to view both basic HA information and error-specific logs:(M) FAD1 # diagnose debug ha basic ha debug basic enabled (M) FAD1 # diagnose debug ha errors ha debug errors enabled
Note: Entering the same option again will toggle it off.
(M) FAD1 # diagnose debug ha basic
ha debug basic enabled
(M) FAD1 # diagnose debug ha basic
ha debug errors disabled
-
Enter the list option to view all HA debug settings.
The example below shows that the basic and errors debug options have been successfully enabled from the previous step.(M) FAD1 # diagnose debug ha list basic: enabled configuration: disabled errors: enabled file: disabled health-check: disabled heartbeat: disabled layer4: disabled layer7: disabled message: disabled state: disabled sync-status: disabled upgrade: disabled arp: disabled
-
Enable or disable the all HA debug option to view the debug information for each enabled setting.
The example below shows the HA debug information for the enabled basic and errors options.(M) FAD1 # diagnose debug ha all enabled all ha debugs (M) FAD1 # [10-09 10:00:58] [kernel]Hello pkt: mode 2 group id 14 local_node_id 0 SN FADV040000146260 sended [10-09 10:00:58] [kernel]Hello pkt: mode 2 group id 14 local_node_id 0 SN FADV040000146260 sended [10-09 10:00:58] [kernel]Hello pkt: mode 2 group id 14 local_node_id 1 SN FADV040000146261 received [10-09 10:00:58] [kernel]Hello pkt: mode 2 group id 14 local_node_id 1 SN FADV040000146261 received (M) FAD1 # diagnose debug ha all disabled all ha debugs
Use the diagnose debug disable command to turn off debugging when you are finished.