
Feature Tour
Working in FortiSOAR
The FortiSOAR interface is based around a common navigation bar on the left side of the application, a global search bar, and filtering within modules. All navigation is built on top of the authorization you are provided according to your RBAC permissions.
For instance, if you have Read privileges to the 'Incidents' module, you will be able to view all Incidents that are within your Ownership Sphere.
Navigation
The navigation bar provides quick access to the components and modules you are authorized to view.
At the highest level, the navigation bar provides Components, which open when you click on the component to reveal a module menu with all accessible modules. For example, when you click on the Incident Response, its module menu reveals the Alerts, Incidents, Tasks, Indicators, War Rooms modules. Module links go to the Module's record listing pages.
Searching
There are three methods of searching within FortiSOAR.
| Search Method | Description |
|---|---|
| Global Search | The Global Search bar at the top of the screen allows you to search for one or more keywords across all records within the system. |
| Table Filter | The Table Filter method allows you to search the name field quickly, such as Incidents, within the context of data within an individual table. |
| Column Filter | The Column Filter method within tables allows you to search specific records from a module, such as Incidents, within the context of an individual data column on the table. |
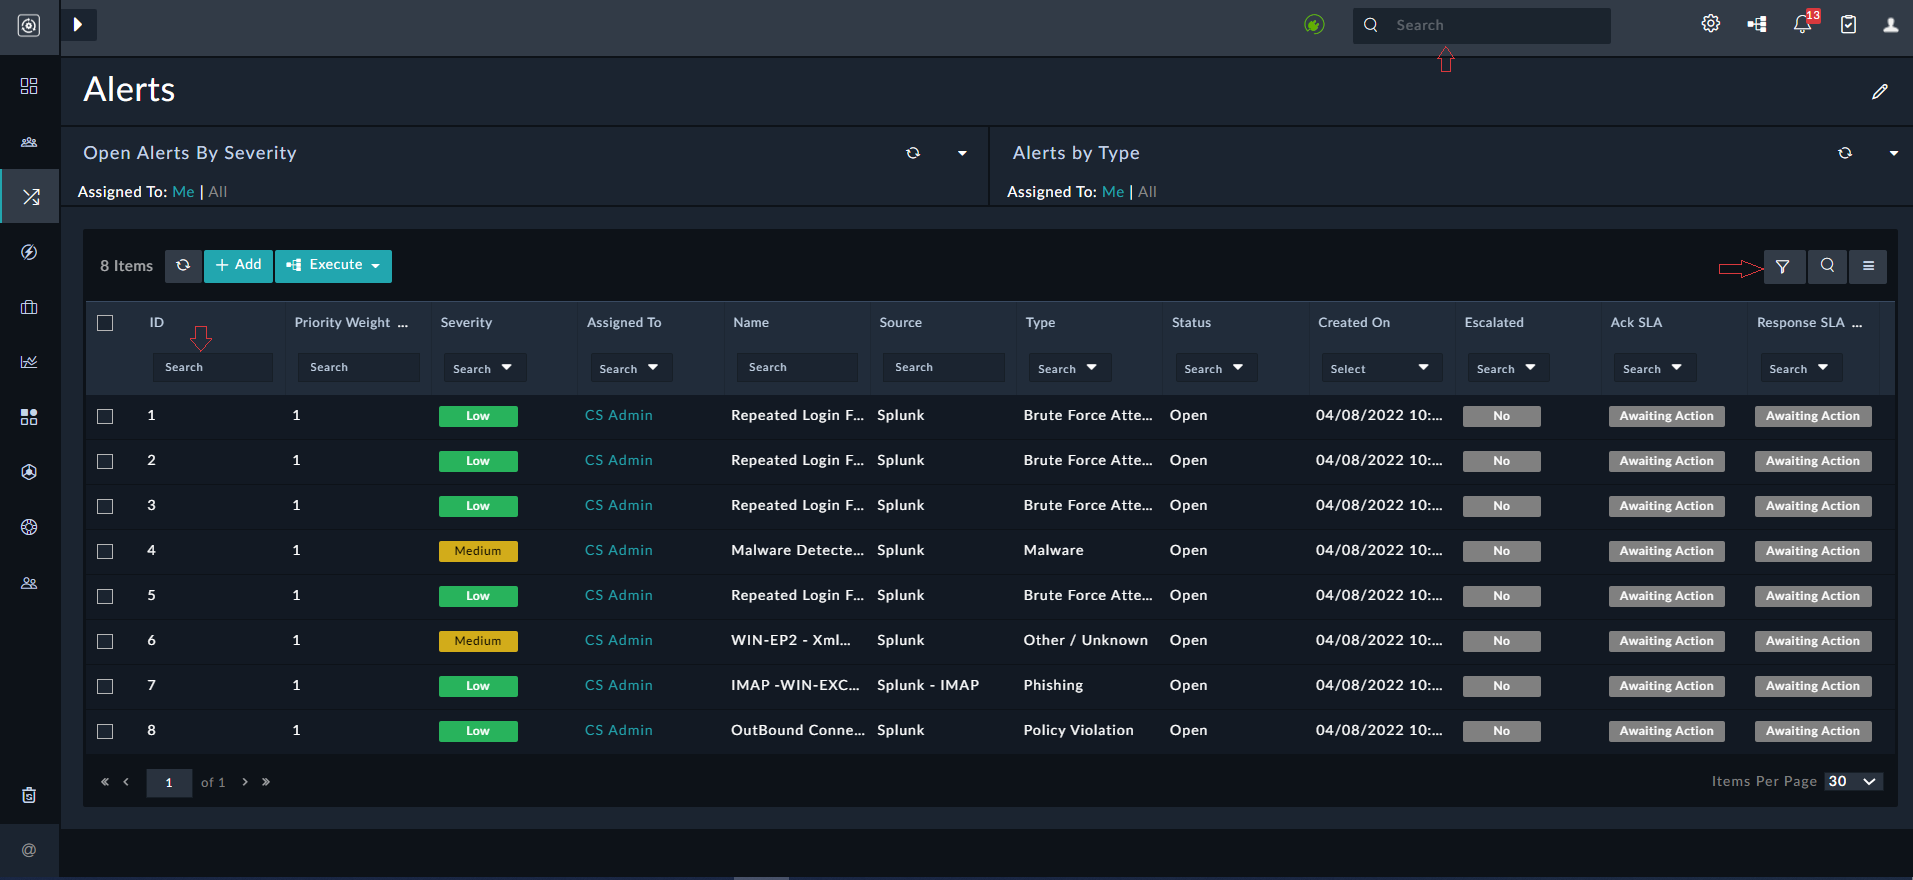
Global Search
The Global Search mechanism leverages an Elastic Search database to achieve rapid, efficient searches across the entirety of the record system. All the record data is stored in Elastic Search, including from file attachments, and made searchable.
The Global Search mechanism respects authorization from users to return search results, meaning users without Read permissions on a Module would not see results returned from that module even if they were found during the search.
Global Search result findings may be exported in the results table to CSV and then stored for future reference if desired.
Viewing Settings and Executed Playbook Logs
The Settings and the Executed Playbook Logs icons appear on the top-right corner of your FortiSOAR screen.
Clicking the Settings icon displays the various administrative settings used to configure and customize FortiSOAR. Your administrator would already have configured these options, therefore you should not edit these options.
Clicking the Executed Playbook Logs icon displays the results of your playbooks that you have executed. 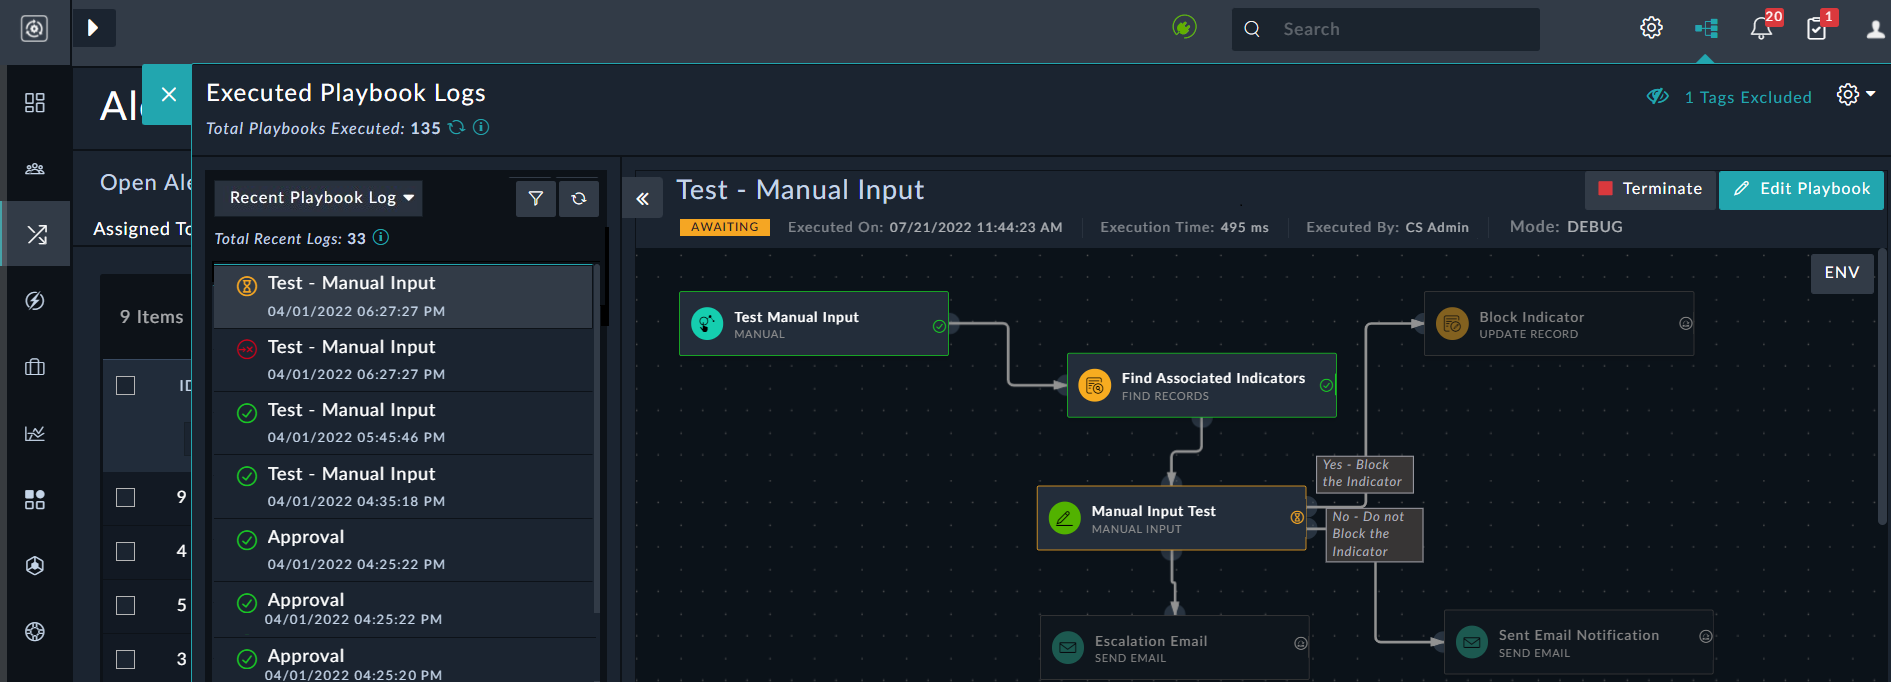
You can also use the executed playbook logs to debug your playbooks. Starting with release 7.6.1, current playbook logs, i.e., playbooks in the primary storage are displayed as 'Recent Playbook Logs' and playbook logs in the secondary storage are displayed as 'Historical Playbooks Logs'. For more information on all the Executed Playbook Logs, see the Playbook Execution and Debugging chapter in the "Playbooks Guide."
Viewing Notifications and Pending Tasks
The Notifications and the Pending Tasks icons appear on the top-right corner of your FortiSOAR screen.
The Notifications icon contains a number in red color that mentions the number of unread notifications. Notifications include informative information, such as failure of workflows, assignment of user on created and updated alerts, incidents, tasks, etc., and actions that are pending for some user action. Clicking the Notifications icon displays the 'Notifications Panel':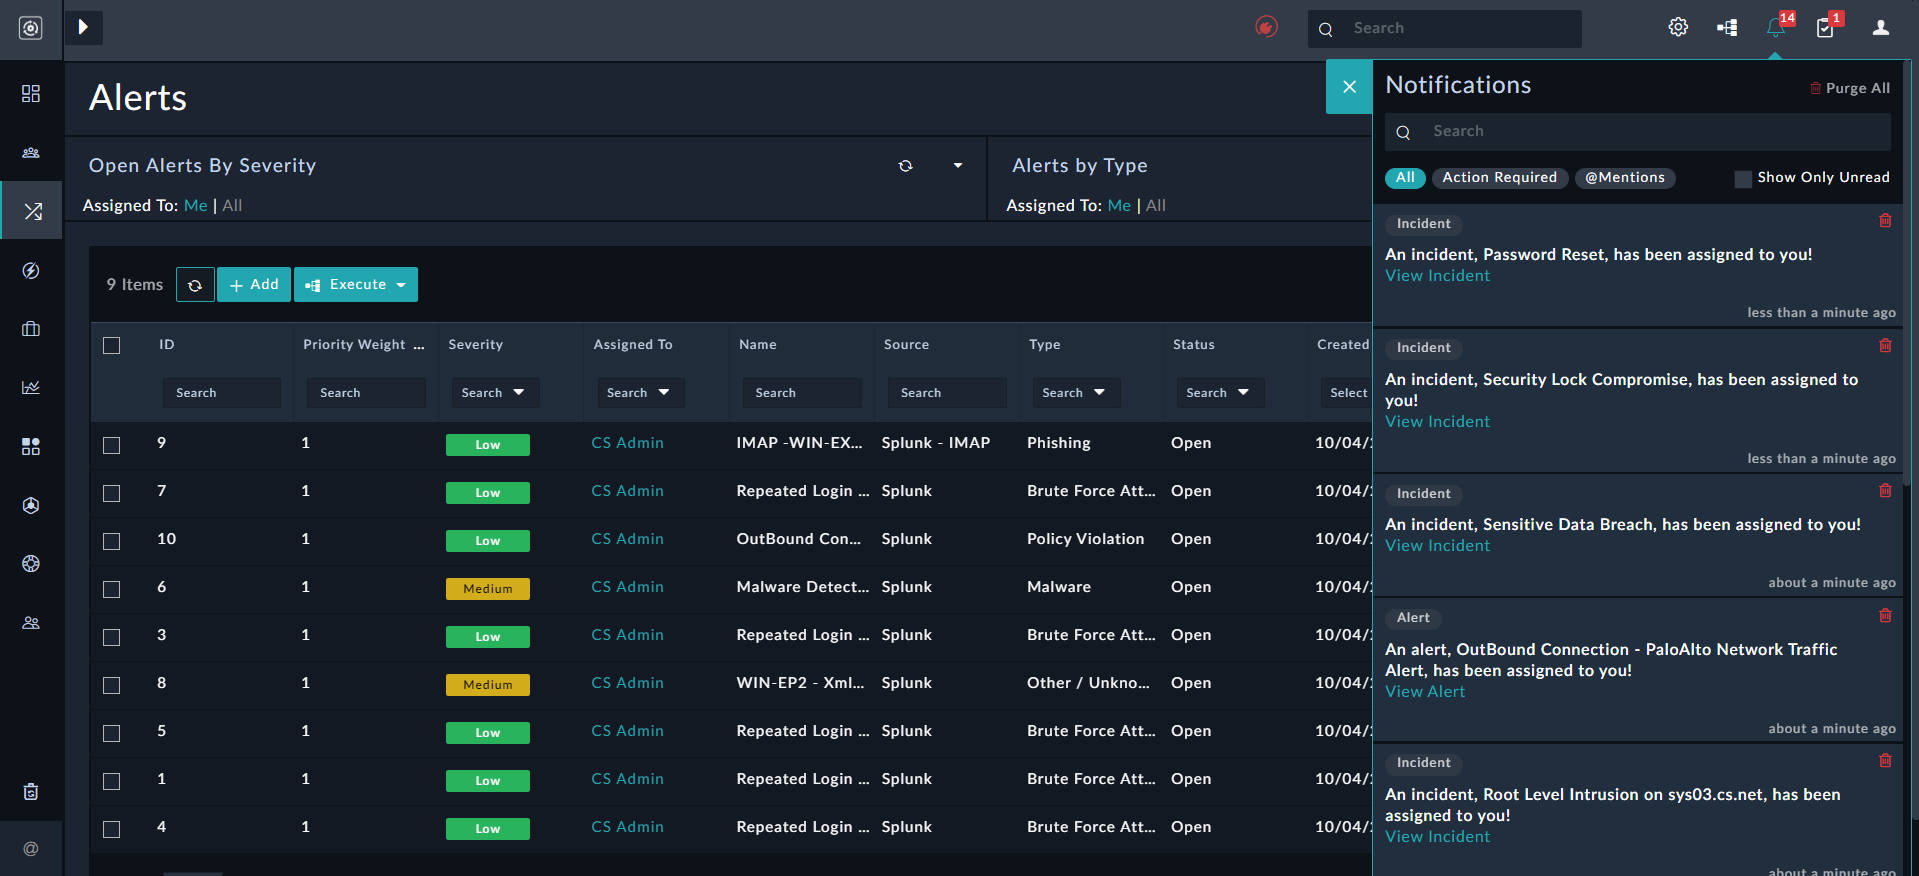
In the Notification Panel, you can use the Search box to search for a particular notification, or filter notifications as follows:
- Click All to display all the notifications.
- Click Action Required to display only those notifications such as approvals, that are pending for some user action.
- Click @Mentions to display a list of comments in which you have been tagged.
- Select Show only Unread to display only those notifications that have not been read. Notifications get read once you click on them opening their corresponding records.
You can also delete notifications from the Notifications Panel or Pending Tasks panel, once you have read them by clicking the Delete icon. However, you can delete only those notifications that are assigned to you and not those that are assigned to a team, or any other user, or system (global) notifications such as workflow failures.
Users with a minimum of Update permissions on the Security Module can also click the Purge All icon to display the Purge Notifications dialog. Click Purge All Notifications to delete all notifications or click Purge All Read Notifications to delete all read notifications: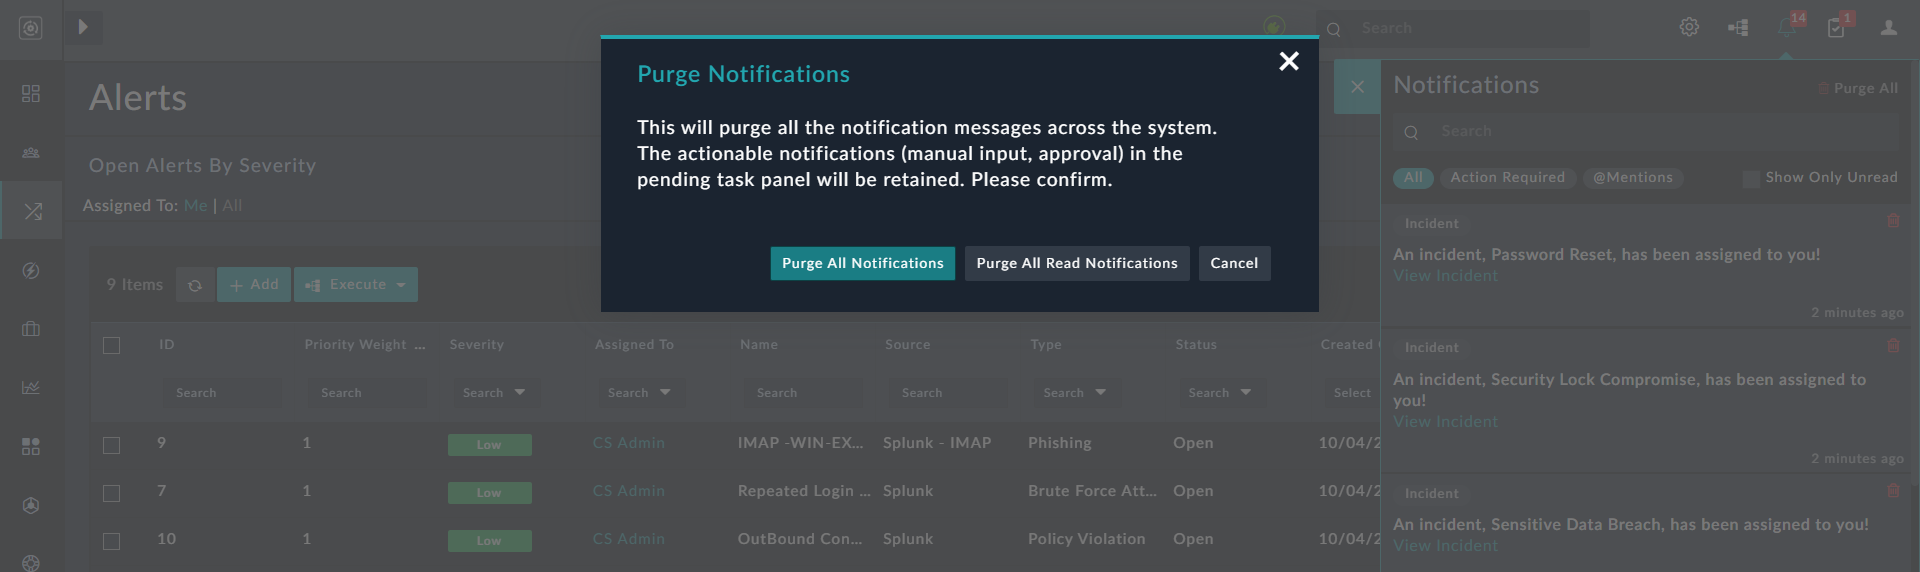
The Pending Tasks icon contains a number in red color that mentions the number of pending tasks, both approvals and manual inputs. Clicking the Pending Tasks icon displays the 'Pending Tasks' panel: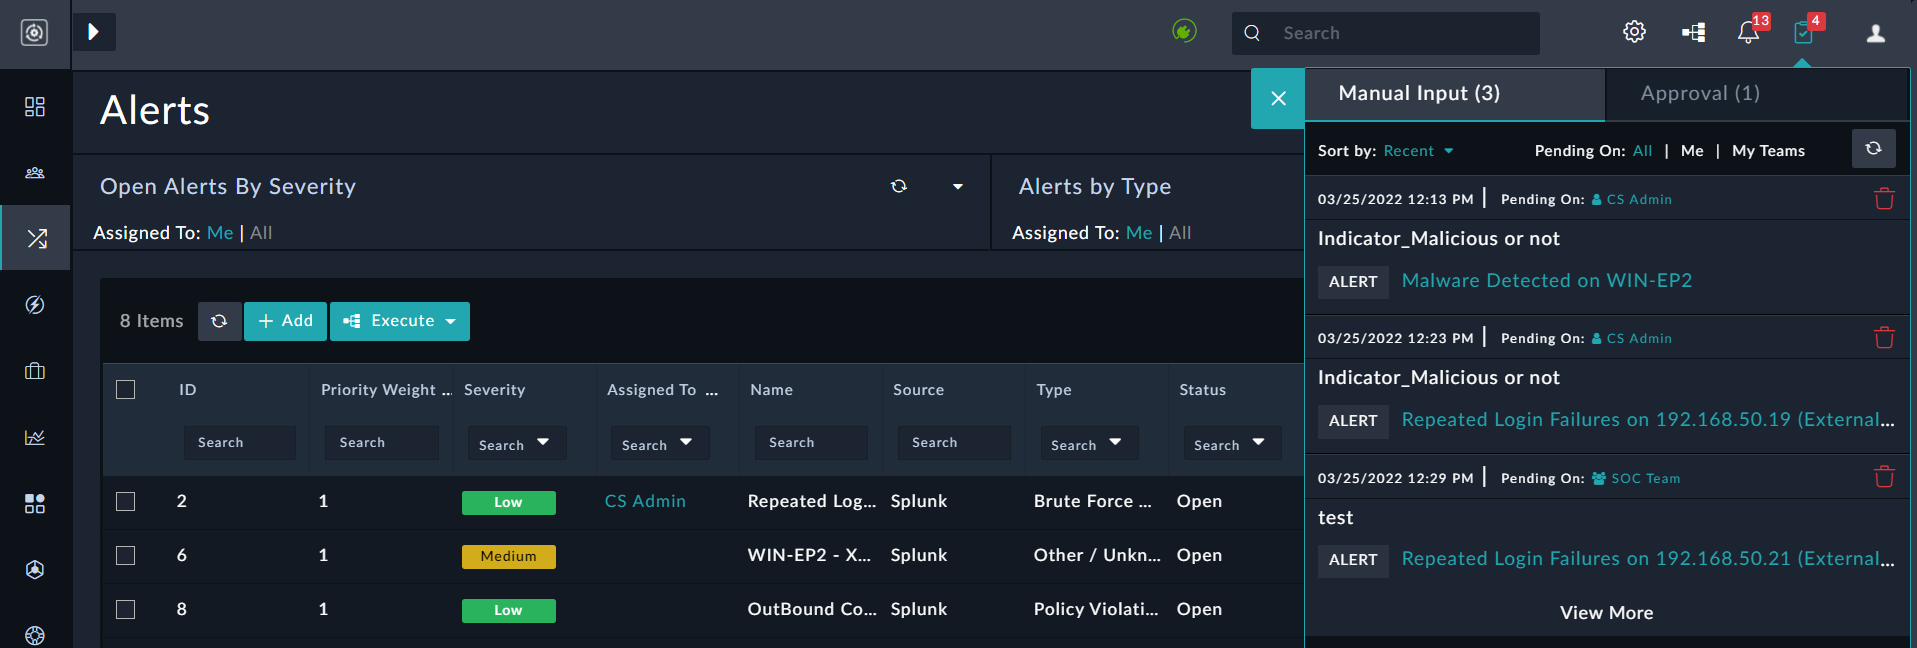 For more information on the pending tasks panel, manual inputs, and approvals, see the Playbook Steps chapter in the "Playbooks Guide."
Adding Records
Add records to a module using the Add button present on top of the grid that lists module records based on RBAC permissions.
Editing Records
Record editing within the record detail view can be accomplished via Inline editing, which allows for quick changes to fields and requires confirmation for all updates.
Additionally, in the detail view of every record is an Edit button on the top right in the breadcrumb bar. This gives you access to a bulk editing interface for all fields that are allowed within the authorization model of your user.
Modules & Models
One of the primary features of FortiSOAR is the ability to provide a clean interface with customized data models optimized for tracking day-to-day security data, such as Alerts.
FortiSOAR unifies the data streams to provide a centralized management interface for tracking. This means Incidents may spend their entire lifecycle rolled up inside of FortiSOAR and working across other related data being tracked, such as Tasks or Assets.
By providing a single place to view and organize security data, much of the overhead and manual effort of going to disparate security tools is significantly reduced. Users are enabled to focus on analyzing the data, not collecting the data.
Models within FortiSOAR are easily customizable according to the needs of an organization via API.
Many modules may be accessed through relationships but might not be directly displayed in the interface navigation. Please see the detailed list of modules provided for more description.
Modules provide access to individual data models within the FortiSOAR database, such as Incidents.
All Module fields are editable and can be customized or extended as needed via API. Models are based on a standard JSON schema.
|
|
We recommend you do not delete the core module fields that are included in your instance without consulting FortiSOAR Support. Deletion of core module fields may result in upgrade issues at a future date. |
Not all modules will be exposed in the navigation. Some of them are only accessible within the context of other modules. You can modify the default navigation if you desire to add new modules at any time.
|
|
From release 7.2.0 onwards, the Incident Response modules have been removed from the FortiSOAR platform and moved to the SOAR Framework Solution Pack (SP). The SOAR Framework SP is the Foundational Solution Pack that creates the framework, including modules, dashboard, roles, widgets, etc., required for effective day-to-day operations of any SOC. As the Incident Response modules, i.e., Alerts, Incidents, Indicators, and War Rooms are not part of the FortiSOAR platform, it becomes essential for users to install the SOAR Framework SP to optimally use and experience FortiSOAR’s incident response. For detailed information about the SOAR Framework SP, see the SOAR Framework SP documentation. |
A brief about the incident response modules follows:
- Alerts: Alerts generally represent records that contain a notice of suspicious activity typically triggered in a SIEM.
- Incidents: Incidents generally represent records of an actual breach of security.
- Indicators: Indicators generally represent records that contain simple identifiable information regarding a threat such as an IP or URL.
- Tasks: Tasks represent a discrete action taken by either an individual or automated response. Tasks might link to outside systems, such as ticketing systems, to track specific actions beyond that of your SOC team.
- War Rooms: War Rooms in FortiSOAR is a collaborative space that enables SOC teams to mitigate a critical cyber threat scenario or campaign.
NOTE: Playbooks and Reporting do not have any associated Module definition.
Linking
Individual records are easily linked in the FortiSOAR interface to provide context and make it simple to track relationships. Linking may be contextual or operational.
Operational Links
For instance, an Incident may have multiple Tasks automatically generated based on the type of Incident. These Tasks stay linked to the Incident throughout the lifecycle and allow for an easy operational overview of where an Incident is beyond tracking just the Incident phase.
Contextual Links
In contextual situations, linking provides the ability to relate data records together and increase velocity during Preparation and Analysis activities.
For instance, Alerts link to Artifacts which then may be automatically linked to Assets. Artifacts within an Alert from your SIEM tool may contain information that helps identify and link Asset records making it simple for an Analyst to understand the potential scope of an Alert. FortiSOAR can find identifiable Asset information and then use that to search one or more Asset resources, such as a CMDB, local DNS, or DHCP records.
Linking is accomplished within the record detail view.
Automation
FortiSOAR provides a powerful Workflow Engine where machine-to-machine (M2M) automation, policy enforcement, data enrichment, and notifications, are all available within a simple drag-and-drop interface.
Security Playbooks may be digitized and automated via Workflows. A standard library of Playbooks may be added at the time of installation to provide a quick level of defaults that may then be customized to match the specific use cases of your environment.
Access Control
FortiSOAR utilizes a robust security model with Role Based Access Control (RBAC) as well as team ownership.
RBAC provides Create, Read, Update, and Delete (CRUD), permissions on individual models within the platform. Roles are created by granting CRUD privileges on models within the available models' list.
Teams provide for row-level ownership of records. Teams have an explicit hierarchy model to allow for complex relationships. The Teams you are a member of and their relationships combined define an Ownership Sphere. An Ownership Sphere is the full set of records on which you can exercise your permissions.
Live UI - Web Sockets
Live UI provides users with many benefits, such as immediate refreshing of records in case of an update by users or workflow (playbook or API), without the users having to refresh the views to see the updates manually.
When a user or workflow (playbook or API) updates any record that is being displayed in the following UI components:
- Grid and Relationship grid (view panel)
- Details View Panel
- Collaboration Panel: Comments or Attachments
- Approvals in notification panel
Then these changes are immediately reflected to other users who are active on that FortiSOAR instance.
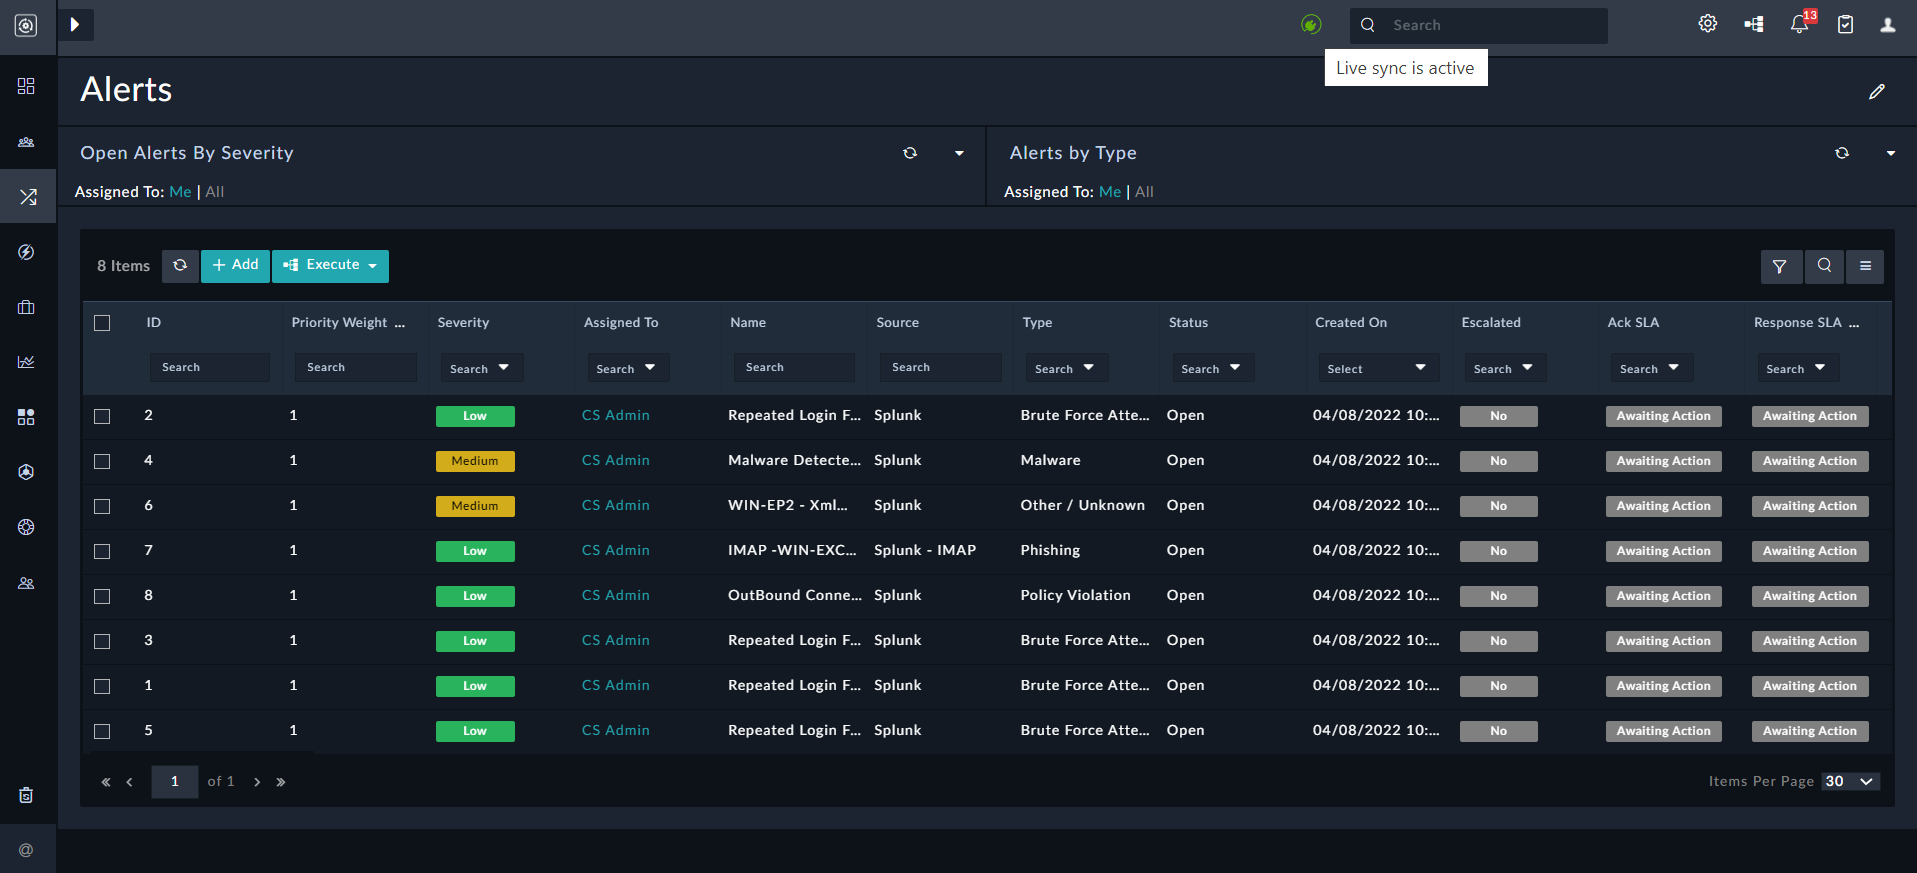
If your FortiSOAR instance is connected to the web sockets server then a green connection icon is displayed at the top-middle of the FortiSOAR UI as shown in the following image:
If your FortiSOAR instance cannot connect to the web sockets server, due to connectivity or any other issues, then a red connection icon and a message such as "Live Sync is not active...." is displayed at the top-middle of the FortiSOAR UI as shown in the following image:
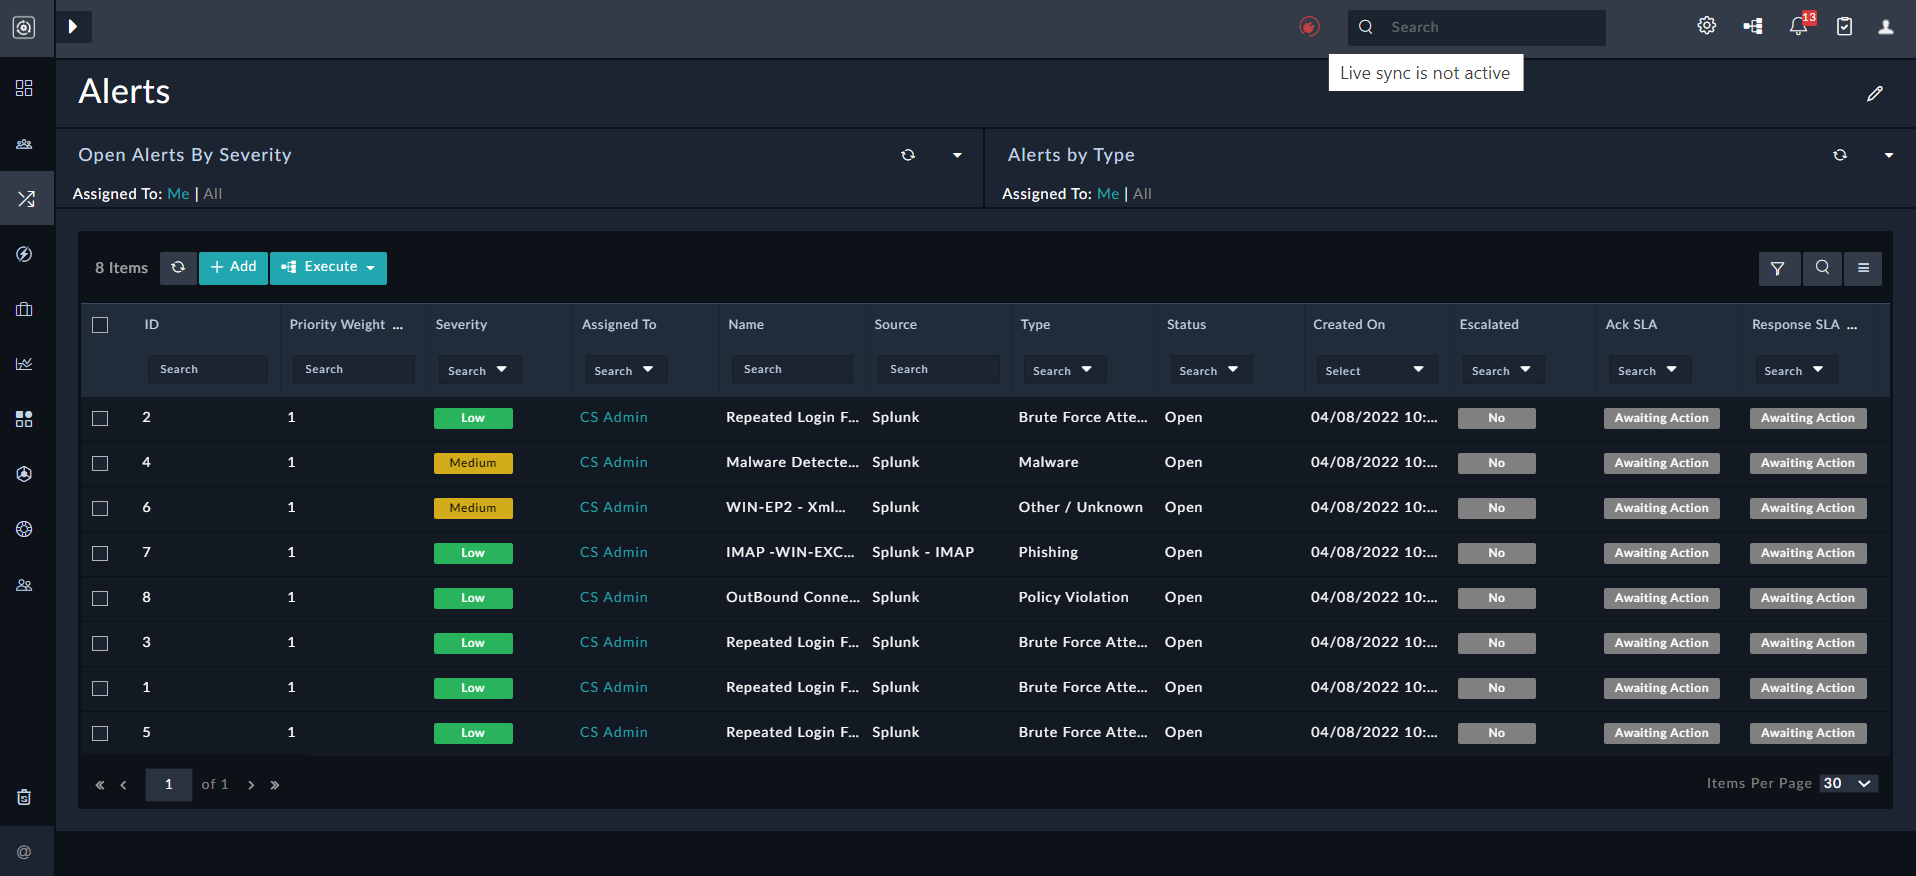
In such a case FortiSOAR also displays a message to the users asking users to use manual refresh to update the views.