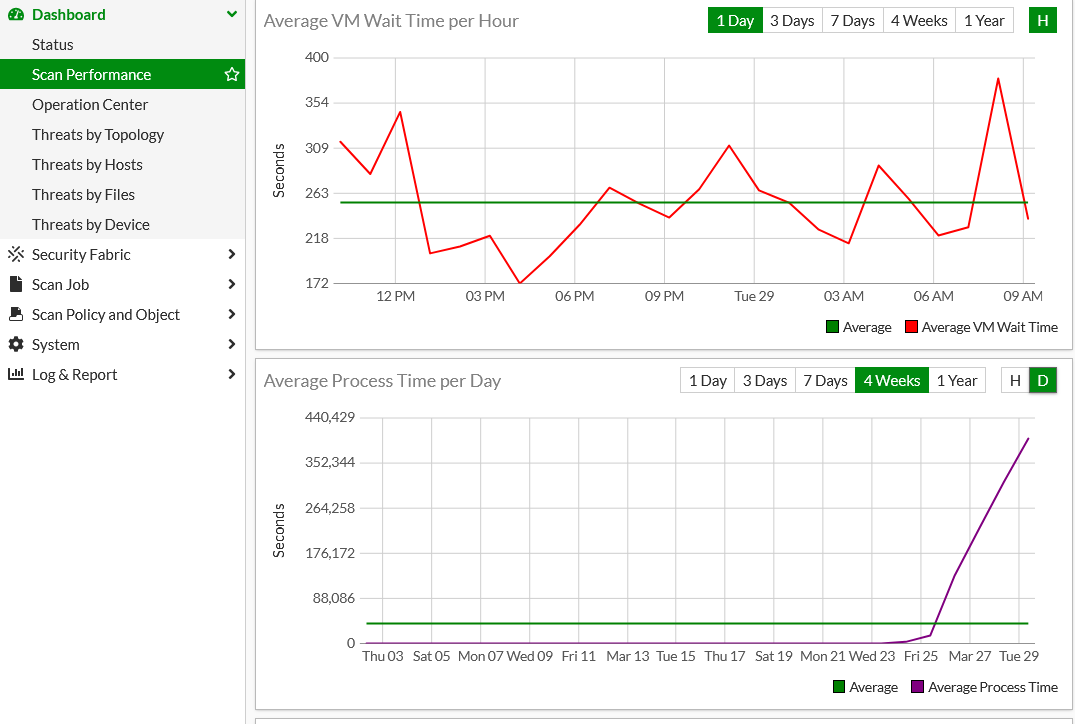
Scan Performance (dashboard)
The Scan Performance dashboard tracks the FortiSandbox performance over time. The data is similar to the Scan Performance widget and is accumulated every 10 minutes. The page is automatically refreshed every 5 minutes. To view the Scan Performance dashboard, go to Dashboard > Scan Performance.
The options for the unit of time will vary based on the time range. For example, the hourly view ![]() is displayed in shorter time ranges (1 day, 3 days and 7 days), whereas the day view
is displayed in shorter time ranges (1 day, 3 days and 7 days), whereas the day view  is displayed in longer ranges (4 weeks and 1 Year).

The Scan Performance dashboard contains the following charts:
| Scanned Count | The total number of scanned jobs per time unit. |
| VM Scan count | The total number of jobs that entered the VM for dynamic scan per time unit. |
| Average Processing Wait Time | The wait time in the initial processing queue. |
| Average VM Wait time | The wait time prior to entering the VM for dynamic scan based on the average calculated time divided by total jobs per time unit. |
| Average Process Time | The processing time from receiving to completing the scan based on the average calculated time divided by total jobs per time unit. |
| Average VM Scan Time | The processing time within the VM for dynamic scan based on the average calculated time divided by total jobs per time unit. |

