
Sensor status
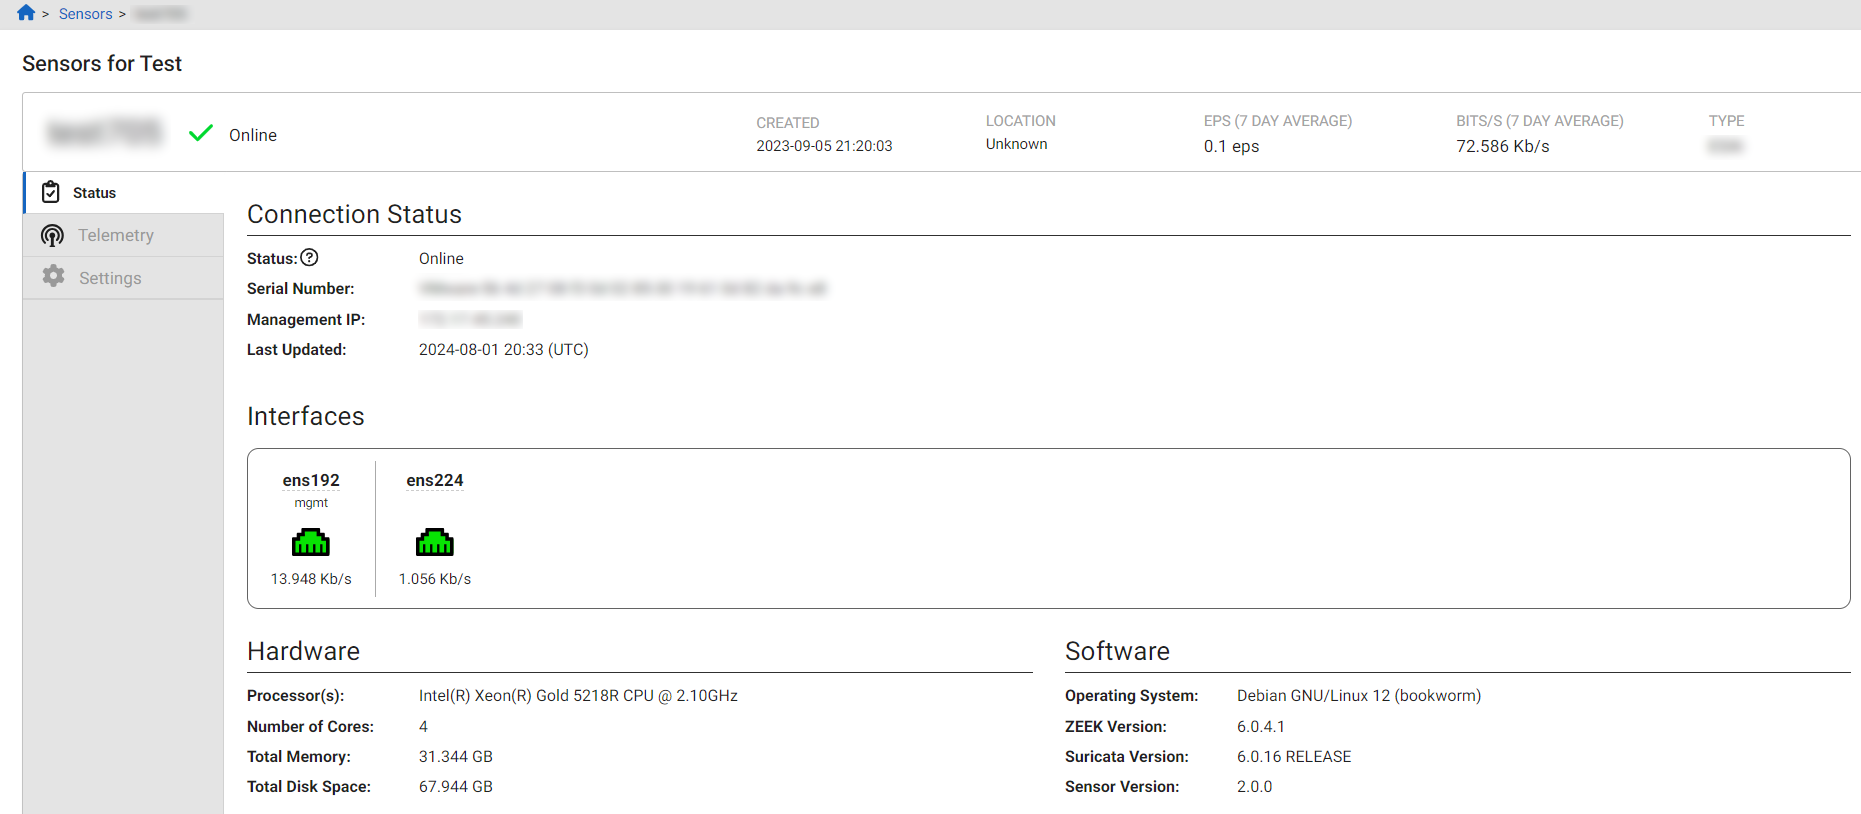
To view the status page for a sensor, click the sensor ID in Sensors page. The Status tab shows information regarding the physical deployment of the sensor.
Connection Status
The Connection Status section displays the state of the sensor's connectivity to FortiNDR Cloud's infrastructure and the IP address of the sensor's management interface.
The Interfaces section lists each network interface on the sensor. The sensor's management interface is indicated with the string mgmt. A green interface means a cable is connected, while gray indicates no connection. You can click the interface label to view its MAC address. On the Sensor Details page, each interface also displays its IP address—if that information is available in the API response. This is especially useful when the interface is configured as a NetFlow collector.
The following table details the naming convention for interfaces on FortiNDR Cloud sensors.
| Label | Sensor Type | Interface Type | Purpose | Max Bandwidth |
|---|---|---|---|---|
| em4 | Physical | Ethernet | Management | 1 Gb/s |
| em3 | Physical | Ethernet | Monitoring | 1 Gb/s |
| em2 | Physical | Ethernet | Monitoring | 10 Gb/s |
| em1 | Physical | Ethernet | Monitoring | 10 Gb/s |
| p#p## | Physical | Fiber | Monitoring | 10 Gb/s |
| eth0 | Virtual | Virtual | Management | N/A |
| eth1+ | Virtual | Virtual | Monitoring | N/A |
|
|
The Max Bandwidth column shows the physical limitation of the interface, not the maximum sustained bandwidth that the sensor can handle. |
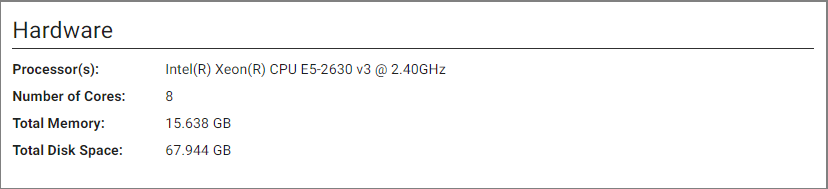
Hardware
The Hardware pane displays the sensor Processor(s), Number of Cores, Total Memory and Total Disk Space.
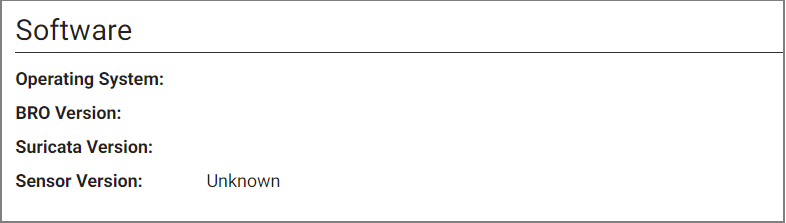
Software
The Software pane displays the Operating System, ZEEK Version, Suricata Version and Sensor Version.
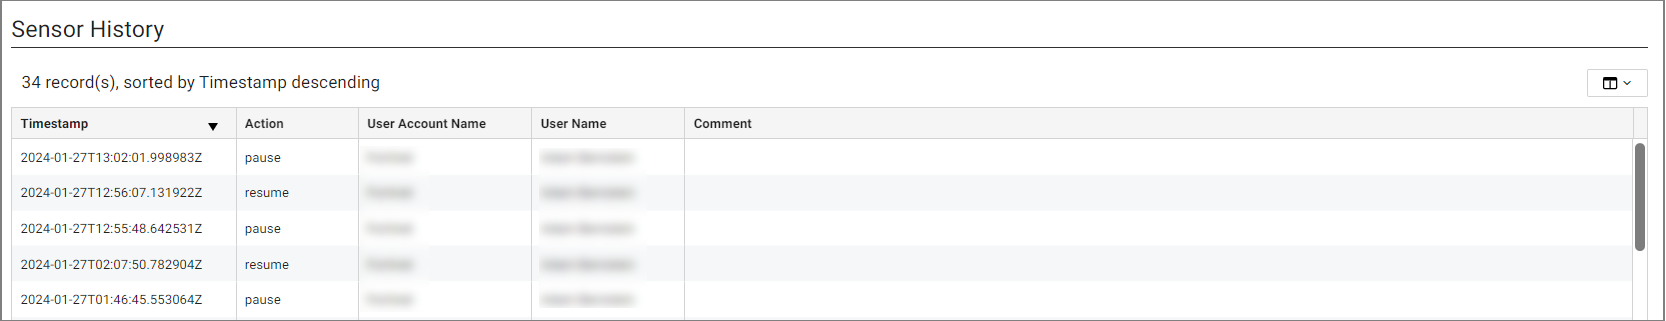
Sensor History
The Sensor History table shows the actions performed (paused or resumed), the user who initiated the action, well as any comments from the user. The table is sorted in descending order by timestamp. A message appears if there is no history to display.
Telemetry
The Telemetry tab plots measurements of total throughput across the sensor's interfaces in bits per second, and the number of events produced by the sensor. These plots can be found on the Throughput and Events tabs, respectively. Measurements for both are available in perpetuity. Each plot can be displayed as either a line or bar plot for any time period, and the Events plot can be grouped by event type.
The legend in the Events tab displays the total throughput count for each individual sensor from highest to lowest. Use the toggles in the legend to show or hide a line in the graph. You also have the option of showing or hiding all entries.
The Telemetry page also displays observed devices for the sensor on the Visibility tab. This data is essentially a slimmed down version of the Devices page.
You have the option of viewing the table as a line or bar graph. You can also group the data by Interface Name, set the Interval to Day, Hour, or 5 Minutes, and download the data as a CSV file.
|
|
The Traffic by Type custom dashboard displays the data in the Events tab in the Sensor telemetry page. When you click the widget header it opens the Sensor telemetry page. All the filters applied to the widget will be transferred to the Sensor Telemetry page. See, Creating custom dashboards |
Settings
The Settings tab shows the configurable fields for a sensor. This includes a sensor's location, arbitrary labels (hostname, site/building code, etc.), and whether to enable PCAP.
|
|
To modify these settings, contact your Technical Success Manager. |
|
|
Enabling PCAP has security and privacy complications. Before enabling PCAP, consult with your Technical Success Manager. For example, networks with data that is subject to regulatory requirements may require certain controls to be in place before enabling this feature. Enabling this feature may also require uploading a public key to encrypt any PCAPs. See, Account management or contact Customer Support for more information on public keys. |