
Detections visualizer
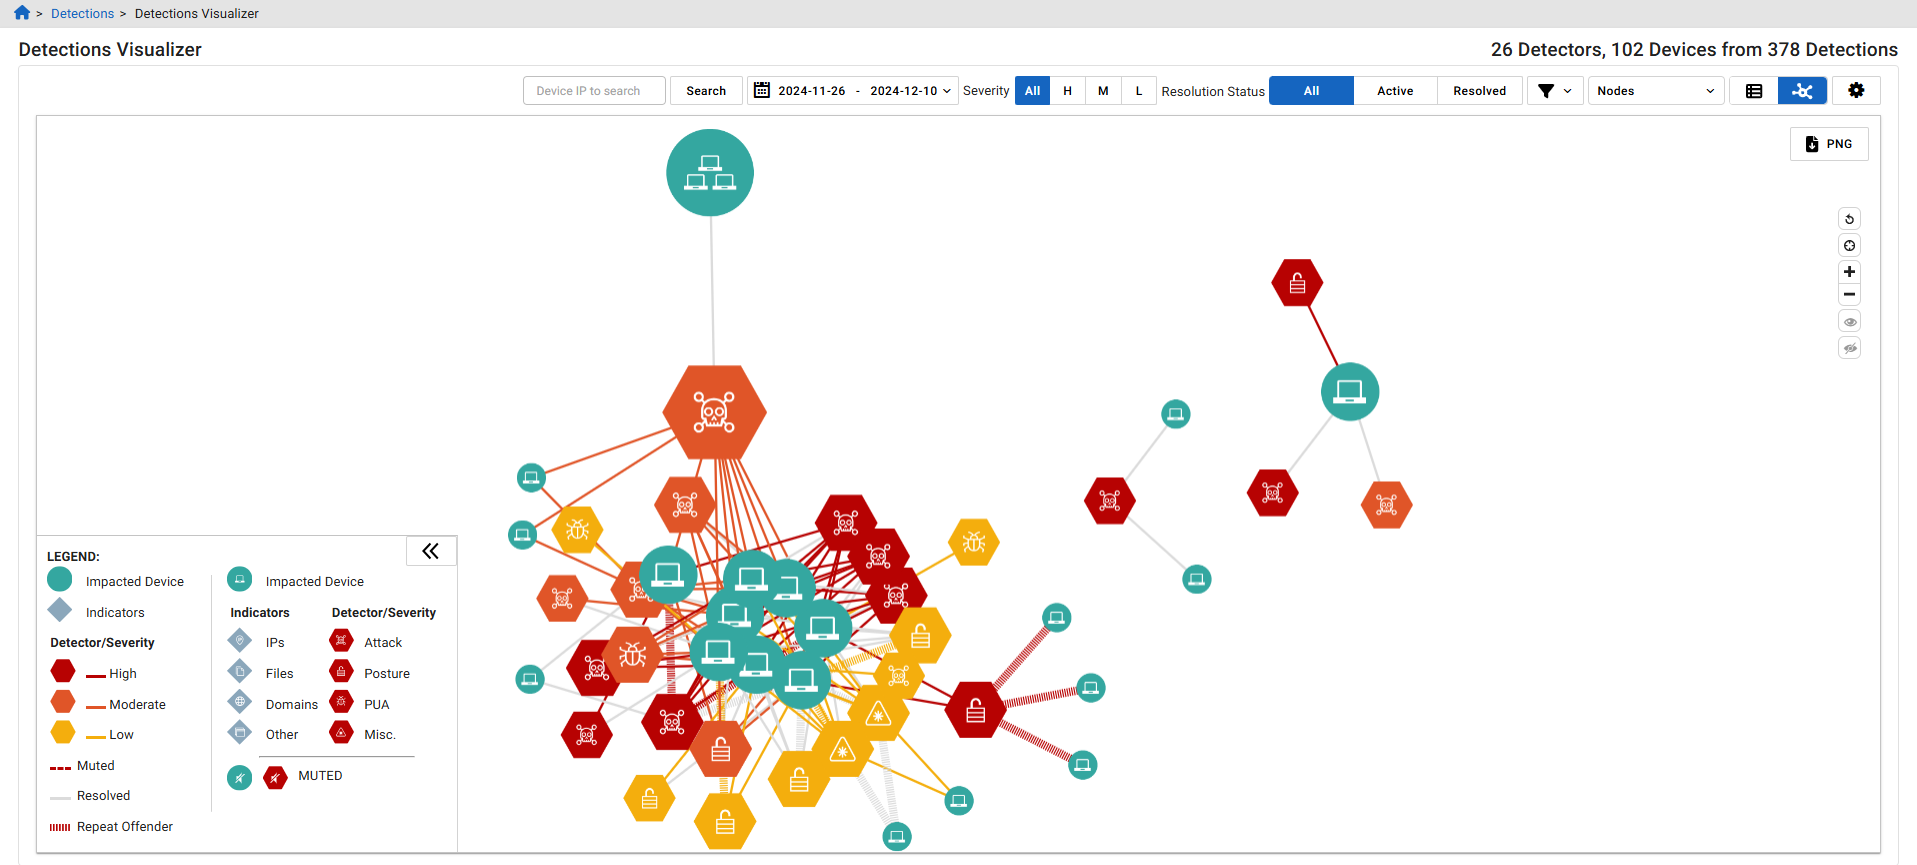
Go to Detections > Detections Visualizer to view detections data from existing APIs in a graphical interface. You can use the visualizer to view the relationship between the detectors and devices, inspect detectors and impacted device details, and navigate to the node view from the list of impacted nodes.
The visualizer will initially display all active, unmuted detections over the past 14 days in graphical form with nodes representing impacted devices and detectors.
Nodes
You can hover over the nodes in the Visualizer to view summary information about a detector, device, indicator or connector line. Click a node to open the Quick View panel on the right side of the page. Right-click a node to open a context menu.
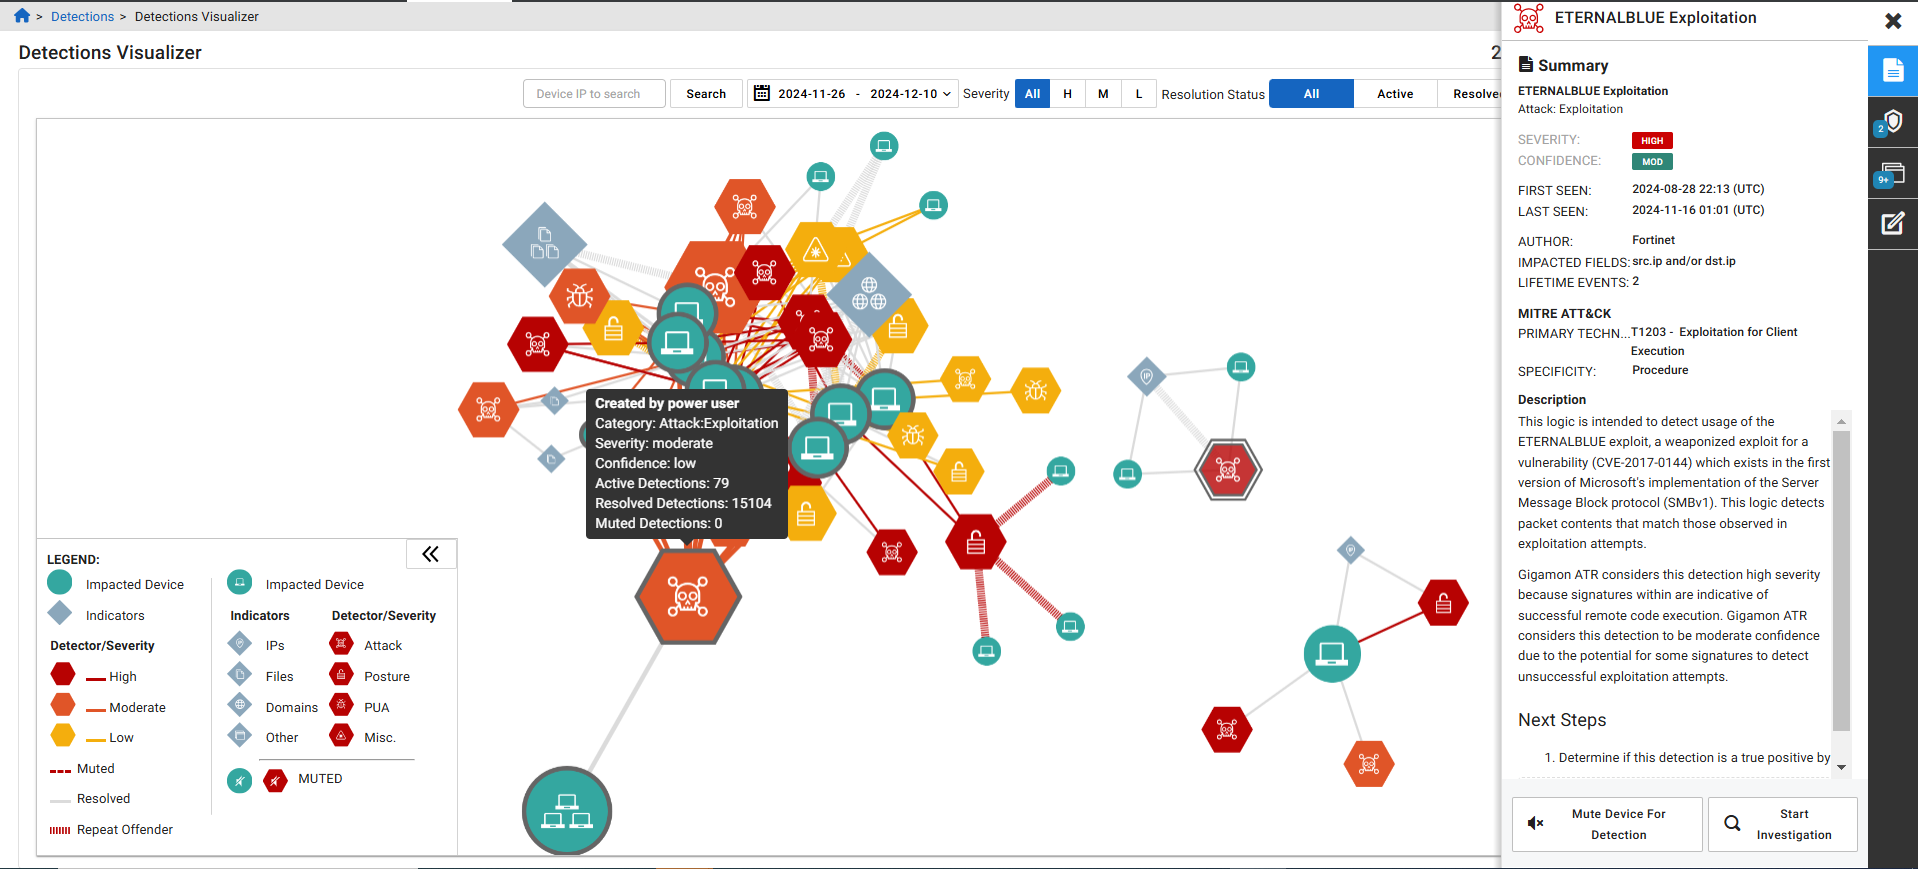
| Detector nodes | Hover over a detector node to view related information about the detection such as the detector's Category, Severity, Confidence rating as well as the number of Active and Resolved Detections. The detector and its impacted devices are also highlighted. | ||||||||||||||||||||
| Device nodes |
Hover over a device node, to view the device IP address. If you hover over a device group, the list of IP addresses is shown. The device group and related detections will be highlighted. Right-click a device node to show/hide the label or the node, add an annotation, or mute the device |
||||||||||||||||||||
| Indicator node |
Hover over an indicator node to view the indicator and to highlight related detections and devices. Right-click an Indicator node to show/hide the label or the node, or add an annotation. |
||||||||||||||||||||
| Connector lines |
Hover over the connector lines to view summary information pertaining to what the line connects, such as the indicators, device IPs, and/or detections. Related devices, detections, or indicators will be highlighted. Right-click a connector line to resolve the detection or mute the device for that detector. If any node is a group or can be grouped, you will have an option to Expand (ungroup) or Collapse (regroup) the set of nodes. |
||||||||||||||||||||
| Quick views |
Click a node in the Visualizer to open the Quick View panel at the right side of the screen. Quick Views display summary information as well as a series of detail-view options and actions. The available options and actions will vary depending on the type of node selected.
|
Filtering the Visualizer
Use the filters at the top of the visualizer to change the content displayed in the canvas. Some filter options are static, others are dynamic based on the criteria selected elsewhere. When you modify the filter, the graph will be redrawn per the selected options. The Visualizer can retrieve up to 10,000 detections from the API regardless of the filter criteria.
Use the Nodes filter to select the types of nodes to display. There are three types of nodes:
- Indicators
- Impacted Devices
- Detectors
|
|
When the Indicators option is selected, groups of indicators and impacted devices related to the same detector may be clustered together on the graph. While any combination can be selected, omitting Detection Name will usually result in a disjointed graph. |
Action buttons
|
|
Export the current graph as a PNG file. |
|
|
Reset the graph (resets all filters, reloads data, and generates a new graph). |
|
|
Recenter the graph (fits all existing data in the screen). |
|
|
Zoom in or out. |
|
|
Reveal hidden nodes. This option is available after one or more nodes have been hidden. To hide a node, right-click it and select Hide node. |
|
|
Hide hidden nodes. This option is available after one or more nodes have been hidden. to hide a node, right-click on it, and click Hide node. |


