
Creating Reports
FortiAIOps allows you to define new reports and generate one-time reports. You can select and combine multiple report categories and the subsequent report types (maximum 5) to generate a single report instead of generating multiple reports for each category. These are saved as Report Templates and can be scheduled similar to other reports.
Basic Information
This section allows you to choose a Category of report, Report Type, provide a Name and Report Title.
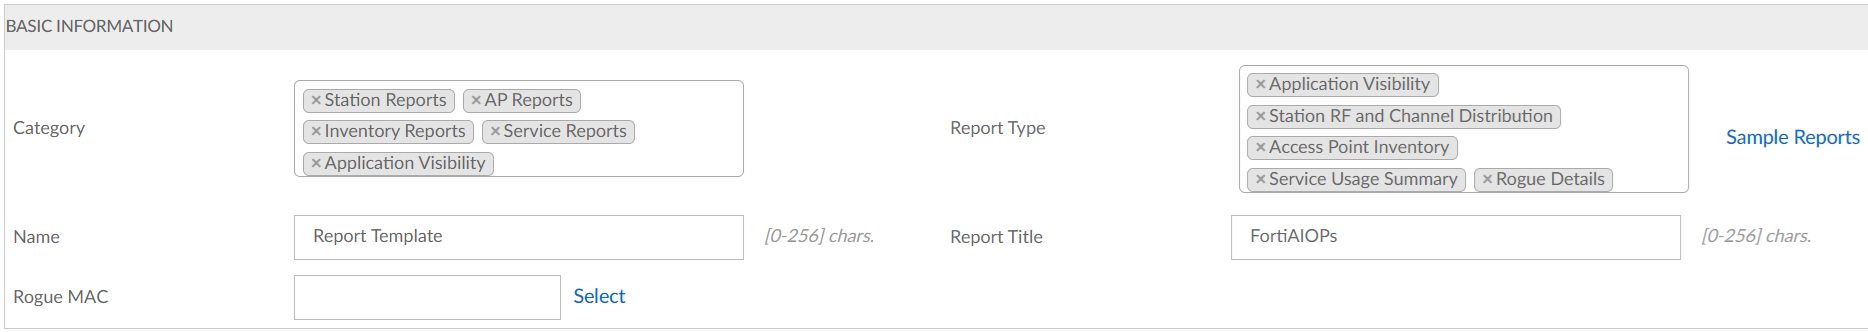
The following categories of reports are supported.
Station Reports
The following types of station reports are supported.
|
Category |
Description |
|---|---|
| Station RF and Channel Distribution |
Provides the station RF and channel distribution based on the OUI (Organizationally Unique Identifier). A graphical summary of the stations distributed by RF type, stations distributed across 2.4GHz and 5GHz bands and station density on each channel over time is displayed. The following details are displayed.
|
|
Station Session Details |
Provides the average station session trend details. A graphical summary of the station session trend details of throughput, loss, airtime utilization and noise for a connected station is displayed. The following details are displayed.
|
|
Top Stations |
The Top Stations report type generates reports for the busiest stations based on the Throughput and Airtime Utilization. This report type generates the top N stations based on the number of bytes transferred and received and total Rx/Tx. The information includes each station's Station Mac, Controller, AP Id, SSID, Throughput (Kbps) and Date/Time (GMT). |
|
Unique Stations |
Provides the unique station details based on all stations connected to a network within the reporting interval. A graphical summary of the stations distributed by RF type, stations distributed across 2.4GHz, 5GHz, and 6GHz bands, stations distributed by OUI, stations distributed by device type, and stations distributed by OS type is displayed. The Unique Station reports are available to all groups and list stations connected to network during last 24 hours. The following details are displayed.
|
|
EAP-AKA Error |
The EAP-AKA Error type generates a report with details of EAP-AKA errors associated with specific ESSIDs and on specific stations connected to network within the reporting interval. The following details are displayed.
|
AP Reports
The following types of AP reports are supported.
|
Category |
Description |
|---|---|
| Rogue Details |
The Rogue Details report type generates the report on the individual rogue. It displays the rogue mobility trend. The trend is plotted against time and APs detecting the rogue. The data displayed is a Max of hourly data sample. The following details are displayed.
|
| Rogue Summary |
Summarizes the rogue device information on the trend of the number of rogues reported on a per controller basis, per hour. The rogue APs and rogue station count is displayed. A graphical summary of the trend on rogue AP, trend on rogue station, and trend on controllers is displayed. The following details are displayed.
|
| Top Radio | The Top Radio report type generates a report displaying all the Top N Radios based on Station Count, Throughput, and High Loss. The top radio report type displays the AP Name, Radio, Controller Name, AP Location, Station and Date/Time (GMT). |
Inventory Reports
The following types of inventory reports are supported.
|
Category |
Description |
|---|---|
| Access Points Inventory |
This report type generates the AP inventory summary reports for any access points that are accessible. The following details are displayed.
|
| Controller Inventory |
Lists and tracks all the controllers, with its model and software versions on the network.
|
| Device Availability |
Lists all the controllers and access points with its availability, uptime and down time of each of them. This report generates the report for each Controller and AP. It displays the Device Name, UP Duration, Down Duration time and Availability(%) for the AP and Controller. |
Service Reports
The following types of service reports are supported.
|
Category |
Description |
|---|---|
| Service Usage Summary |
Provides the service usage summary based on the ESSIDs. A graphical summary of the top SSIDs based on throughput and number of stations is displayed.
|
|
Service Usage Trend |
Provides the service usage trends based on the ESSIDs. A graphical summary of the top SSIDs based on throughput and number of stations is displayed.
|
Application Visibility Reports
The application visibility reports provide the following information.
|
Category |
Description |
|---|---|
| Application Visibility |
This report provides the top 10 applications and the top 10 users in your network which allows you to monitor application usage.
|
Scope
This section allows you to define the scope of a report by performing the device selection followed by the service (SSID) selection.
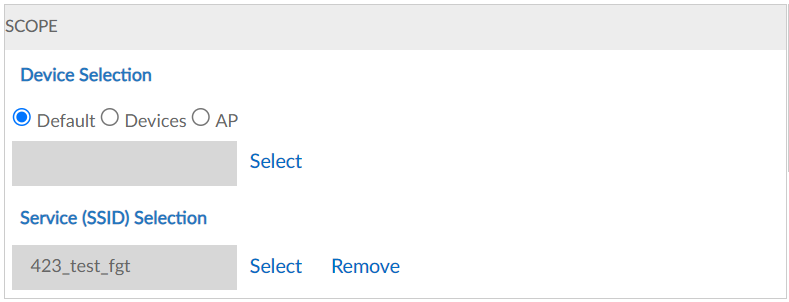
Update the following fields as per your requirement.
-
Default - By choosing default, report is generated for all the controllers mapped to the FortiAIOps.
-
Devices - Select one of multiple FortiGate controllers.
-
AP - Select one or multiple access points.
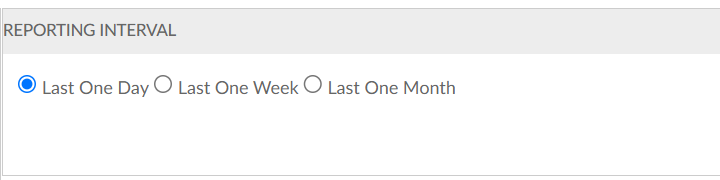
Reporting Interval
These fields depict the time period to be covered by the selected report. These fields are supported for most report types. When these fields do not appear, the report considers the current status. Select the Schedule option of the Recurrence section, the following options in the Reporting Interval section is enabled.
-
Last one day - The last one day's report is generated.
-
Last one week - The last one week's report is generated.
-
Last one month - The last one month's report is generated.
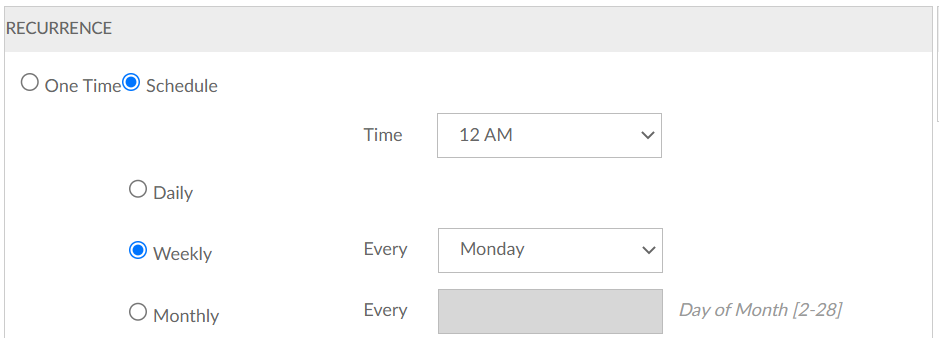
Recurrence
This section allows you to select the time of report recurrence. Select the Schedule option and the following get enabled.
-
One Time - Instant report is generated for the selected reporting interval.
-
Schedule - This option allows you to define a specific time for report creation. These schedule fields establish the time that a report runs, independent of the Scope and Reporting Interval.
-
Daily - This option allows you to generate daily reports.
-
Weekly - This option allows you to generate weekly reports, select this option followed by selecting the day of the report generation from the Every drop-down list.
-
Monthly - This option allows you to generate monthly reports, select this option and enter the day of month; 1-31 is the valid range.
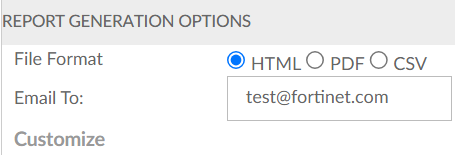
Report Generation Options
You can save the generated reports in any of the following formats and email the generated reports to the specified address.
-
File Format - Choose one of the following formats.
-
HTML - Select the HTML option to export and save the report to HTML format. The generated report is saved with the naming convention, <report type>_report_datetime.html.
-
PDF - Select the PDF option to export and save the report to PDF format. The generated report is saved with the naming convention, <report type>_report_datetime.pdf.
-
CSV - Select the CSV option to export and save the report to CSV format. The generated report is saved with the naming convention, <report type>_report_datetime.csv.
-
-
Limit Report Size To - This option is applicable only to the Top Stations, Top Radio, Device Availability, and Application Visibility reports. The maximum report size for the Application Visibility report is 100.