Access Points Diagnostics and Tools
The Diagnostics and Tools pane displays the details about the selected Access Point/Radio and allows you to run diagnostic tests.
Locate
The Locate button is available in the Diagnostics and Tools pane for the AP view. Click Locate to find the physical location of an AP. The system opens the Wi-Fi Maps window to highlight the placement of the selected AP on its floor plan. For more information, see Locating Wireless Devices on the Map.
The following tabs are available:
AI Insights
The AI Insights tab helps to analyze various performance metrics, identify issues, and provide detailed insights into the root cause of network problems, helping administrators maintain high service levels.
Note: This feature may not work as expected on Safari browser. For the best experience, use Chrome, Firefox, or Microsoft Edge instead.
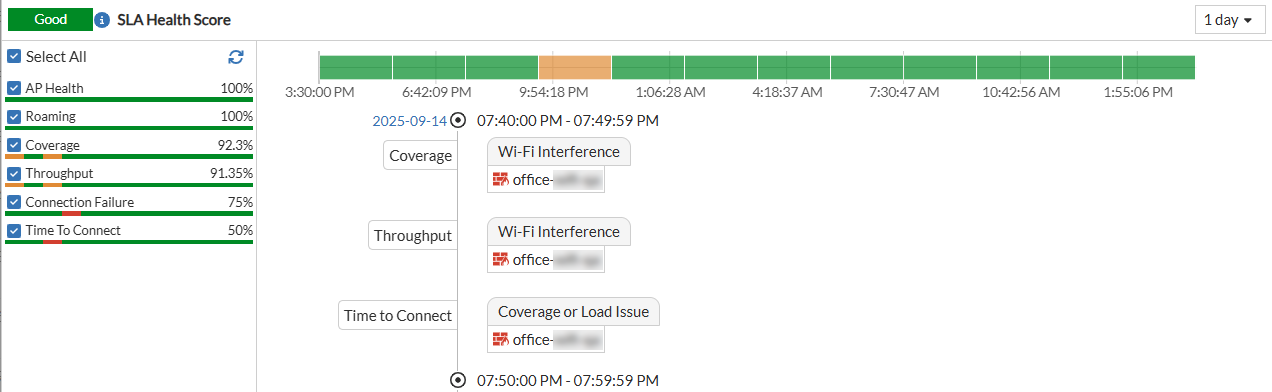
The SLA Health Score provides the overall high-level score.
-
Good for a score more 70
-
Fair for a score between 30 and 70
-
Bad for a score less than 30
Below the overall score, a list of individual SLAs or metrics is shown with their current health scores. You can select the SLAs that you want to track.
The following metrics are available:
-
AP Health
-
Roaming
-
Coverage
-
Throughput
-
Connection Failure
-
Time To Connect
When you click an SLA, the corresponding SLA Summary window opens with more details.
The bar graph shows the performance trend over a selected time period (in this case, 1 day). The graph is divided to equal time segments. Based on the health score of each segment, the segments are colour coded as green (good), orange (fair), and red (bad).
Clicking on a specific time segment displays more details events that occurred during the time period.
Performance
The performance tab displays trends for the FortiAP health, wireless, and wired clients for selected interval.You can filter the trends based on the selected duration or customized time slot; select a time window or define a custom range. The custom range allows the selection of a minimum of 1 day and the maximum is the duration of log retention configured in System > Settings. The minimum, maximum, and average values are displayed when a time interval of more than 6 hours is selected.
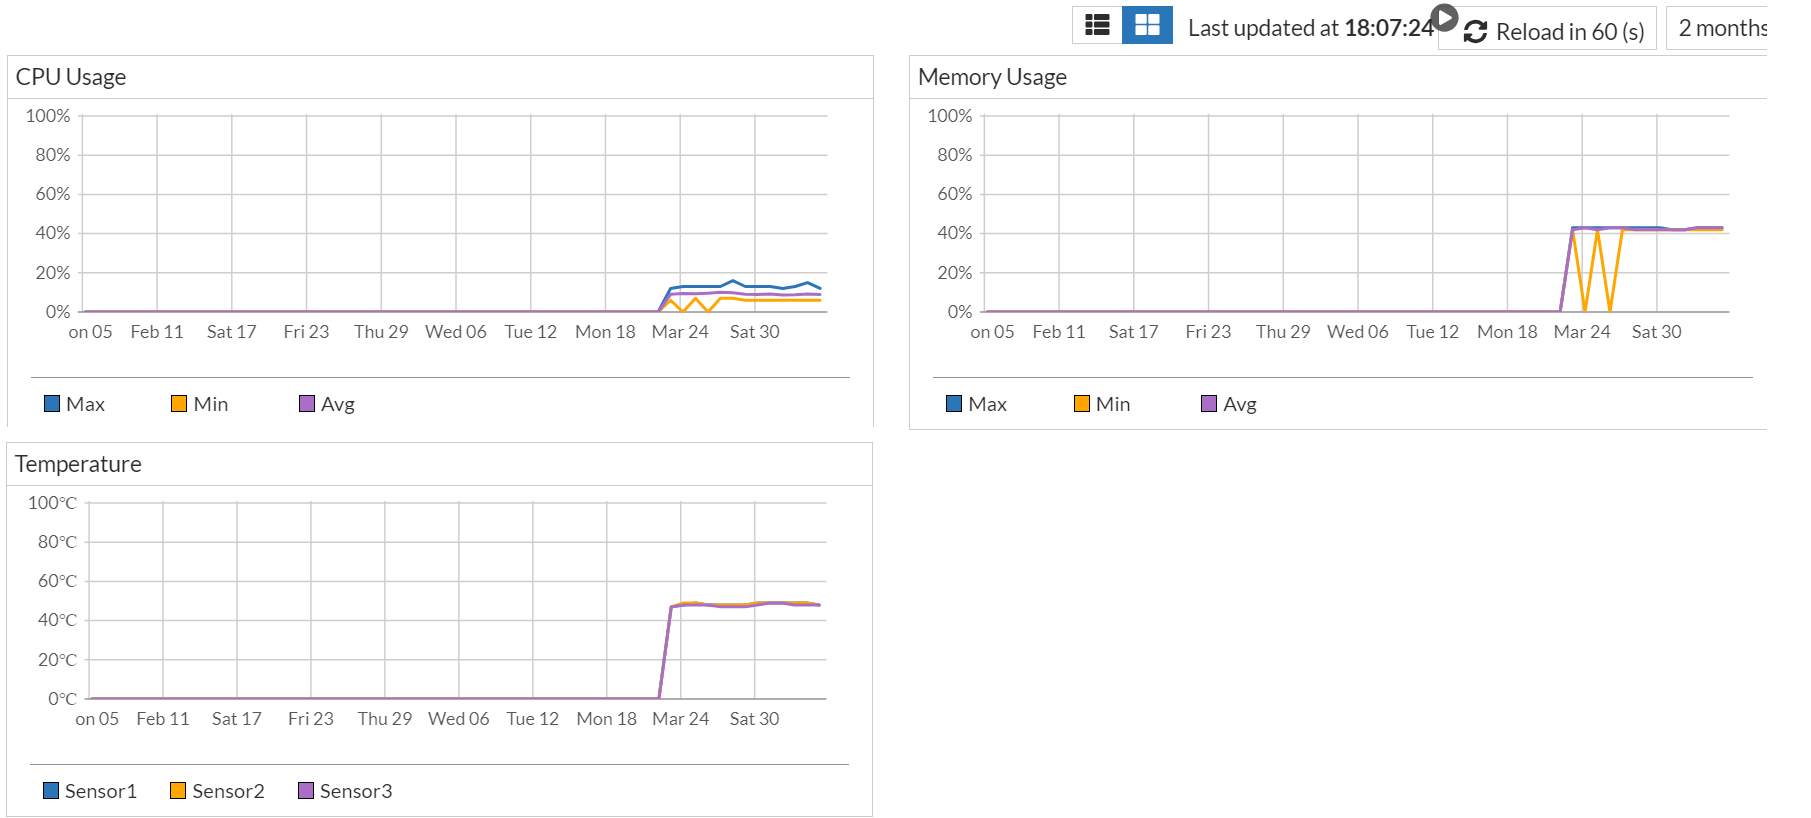
AP Health
This tab monitors and displays the CPU and memory usage by the FortiAP over the selected time interval. At any given point in time, you can view the maximum, minimum, and average CPU and memory usage. This tab also displays the operating temperature of the FortiAP collected by various sensors. The temperatures recorded by all sensors are displayed.
Wireless
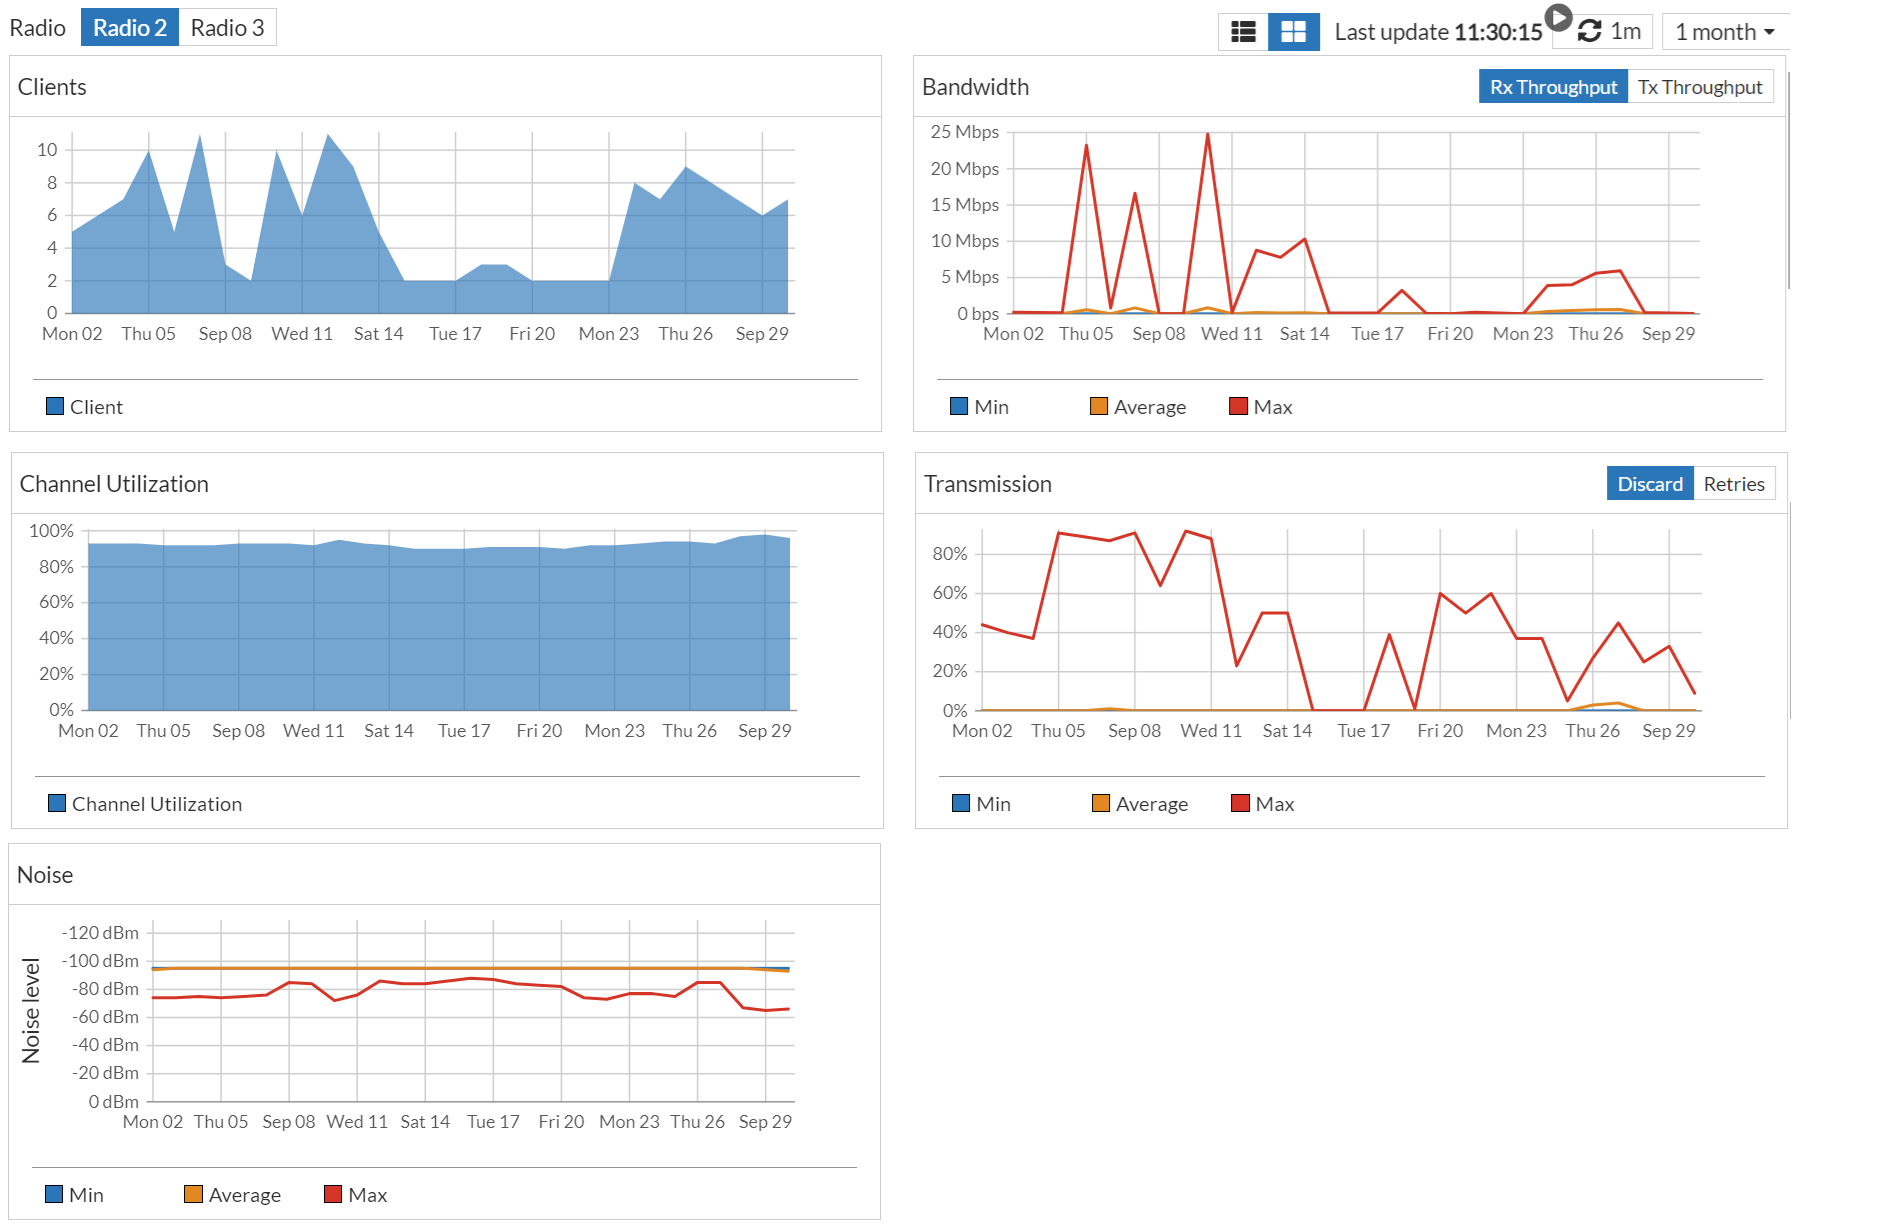
It includes charts for clients, bandwidth, channel utilization, transmission discard, retries, and noise levels on the respective radio interface. The default interval is 10 minutes and can it be changed according to your requirements.
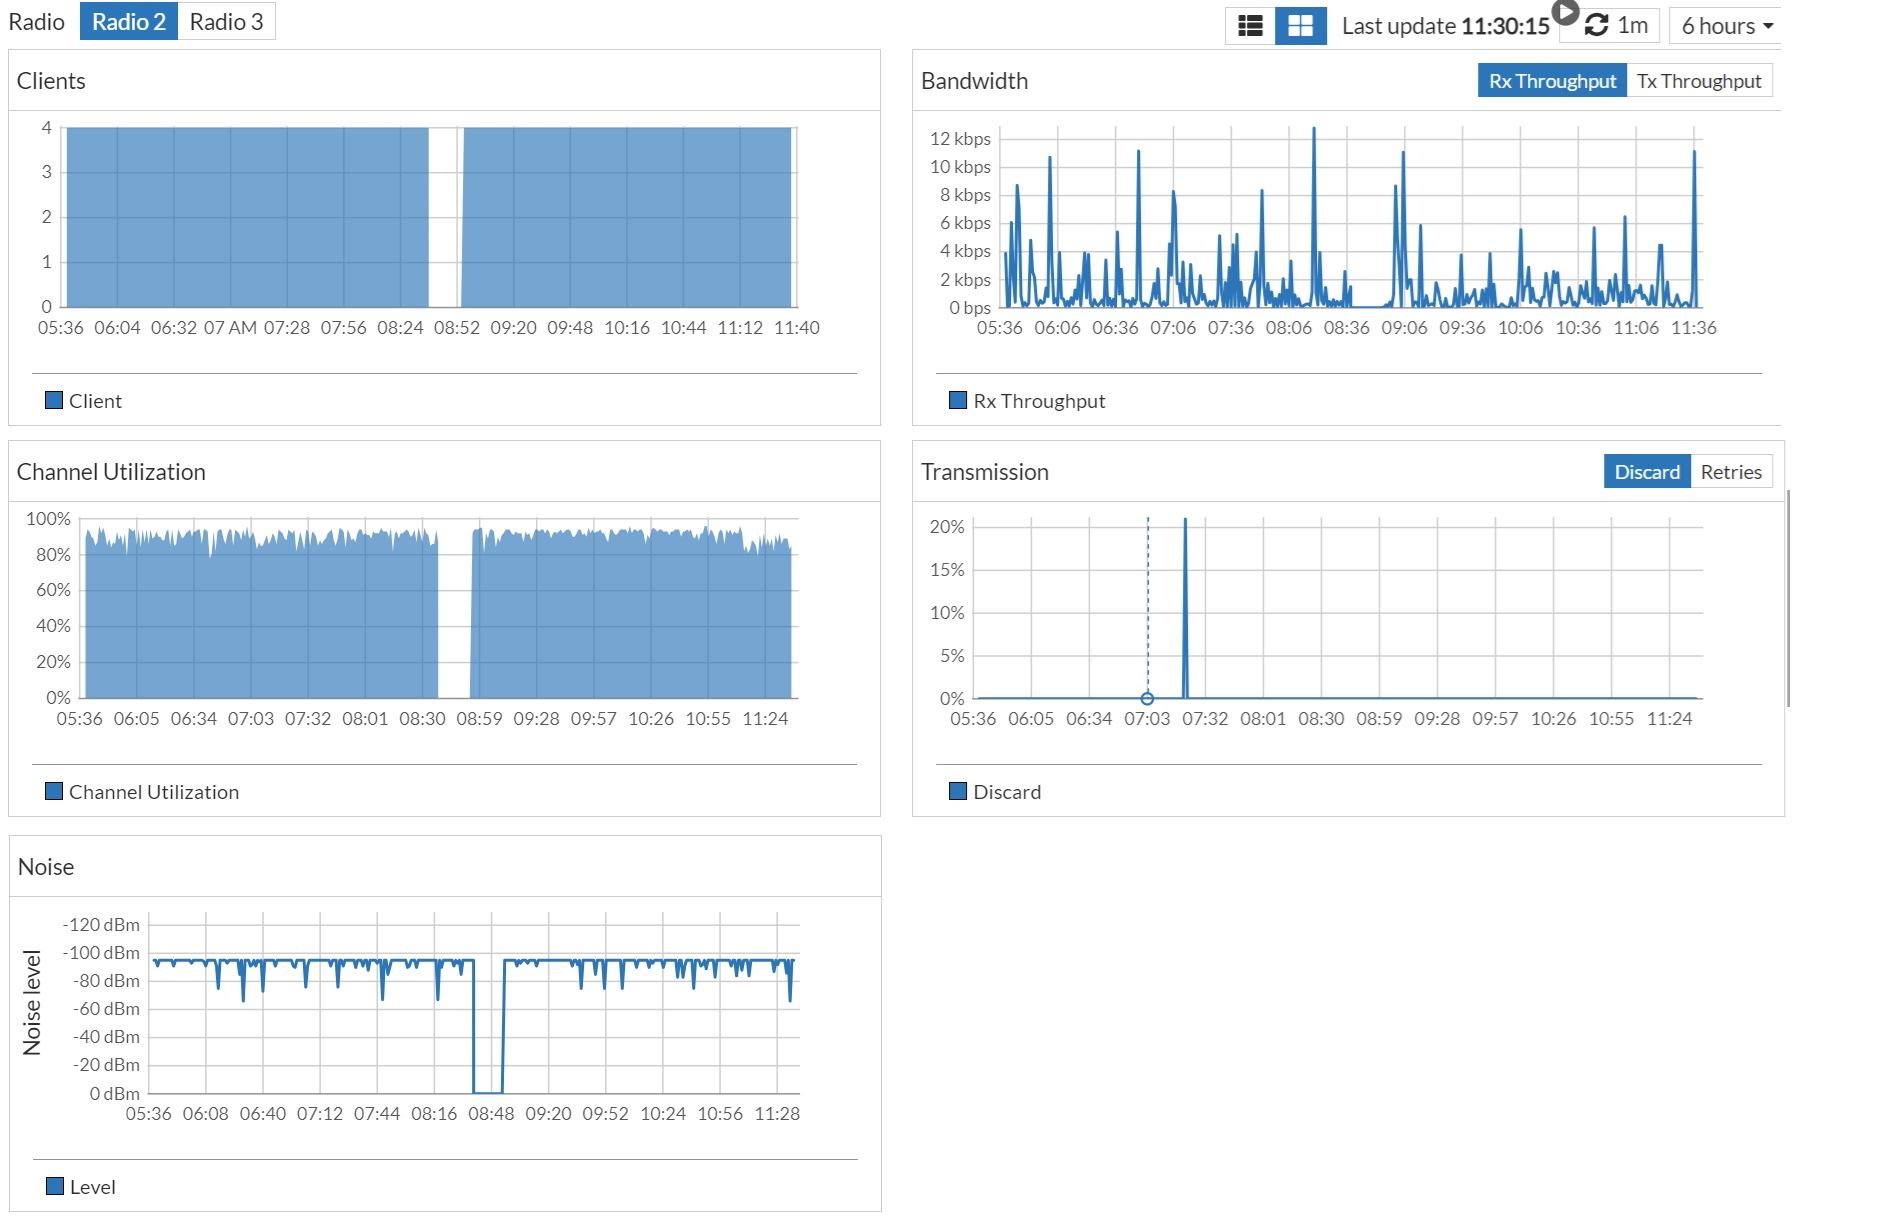
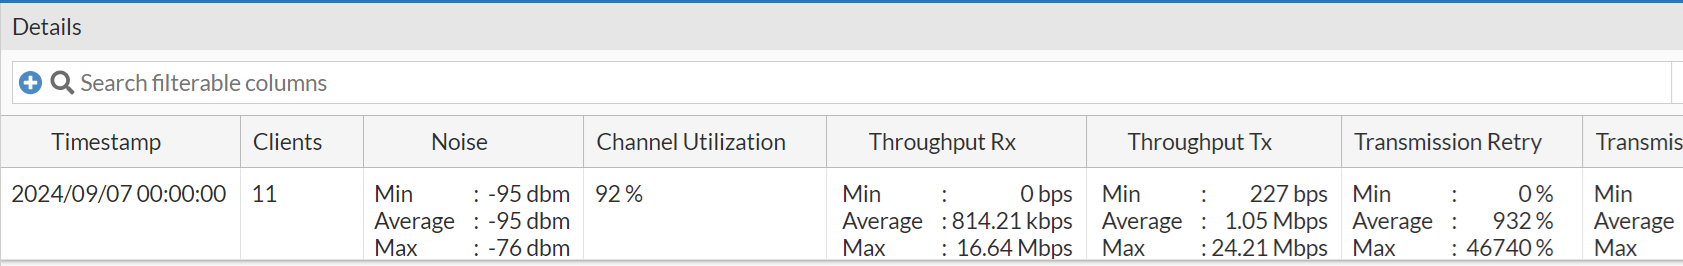
The minimum, maximum, and average values are displayed in the Bandwidth, Transmission and Noise panels when the selected time interval is more than 6 hours, as depicted in the following image.
Click on the graphs for a specific time to view details. The following image depicts the details displayed for an interval of less than 6 hours.
![]()
The following image depicts the details displayed for an interval of more than 6 hours.
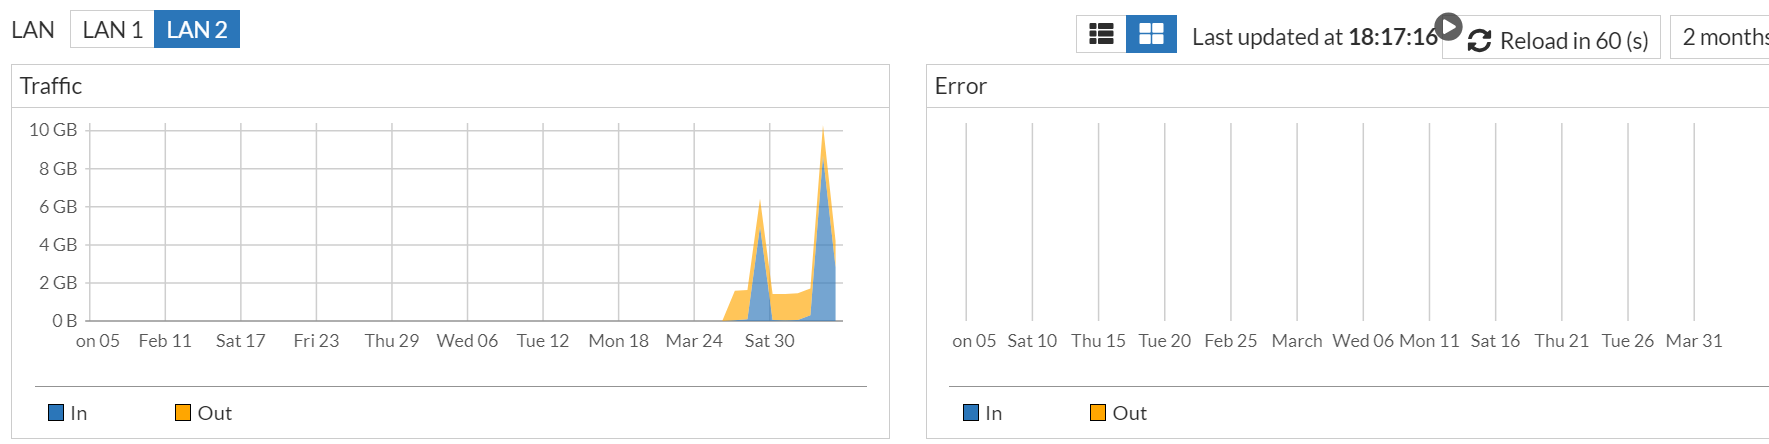
Wired
The LAN port statistics are now displayed for access points. You can view the traffic coming into a LAN port and the traffic leaving it at a given point in time. Also, the error statistics for both incoming and outgoing traffic is displayed.
Note: The LAN port status is not displayed for FAP-421E and FAP-423E.
Clients
The Clients tab helps you monitor your network, based on the retries percentage, SNR, and client distribution. This data is displayed per OS for the selected time interval.
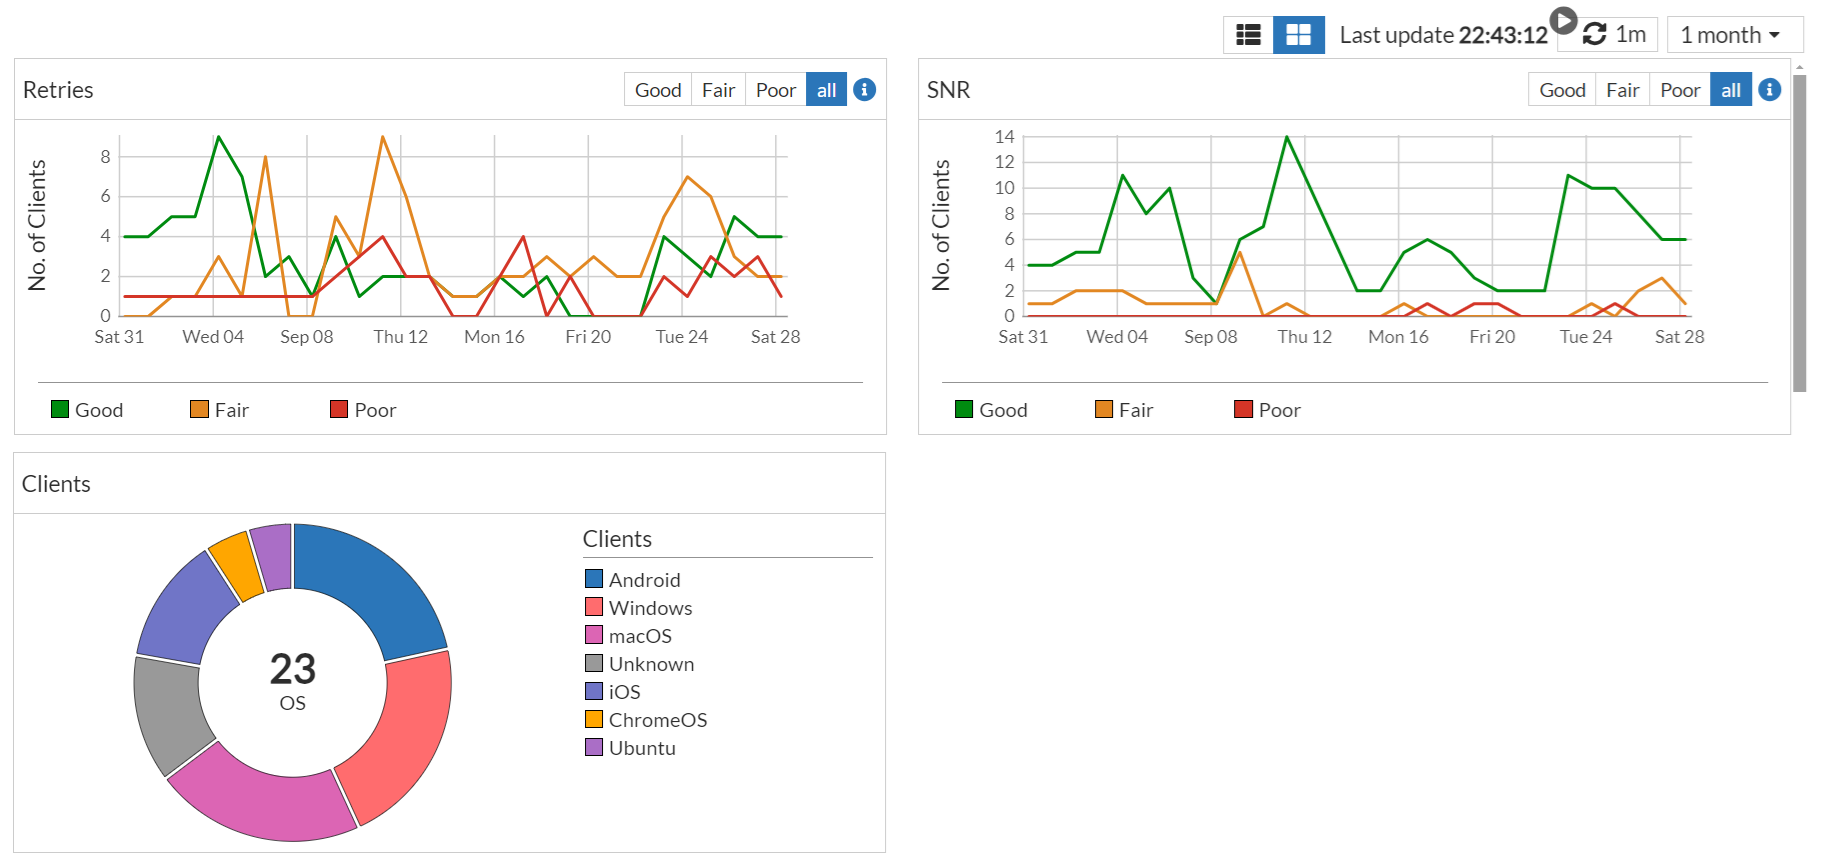
Retries
The statistics for retries are categorized as good, fair, and poor based on the following criteria.
-
Good - Retries are less than 30%
-
Fair - Retries are between 31% - 70%
-
Poor - Retries are more than 70%
SNR
The statistics for SNR are categorized as good, fair, and poor based on the following criteria.
-
Good – SNR is equal to or greater than 25 dB
-
Fair – SNR between 15 and 24 dB
-
Poor – SNR is less than 15 dB
Clients
This panel provides the total number of clients and also the number of clients associated with each OS type. Hover over the graph or the OS name to view details.
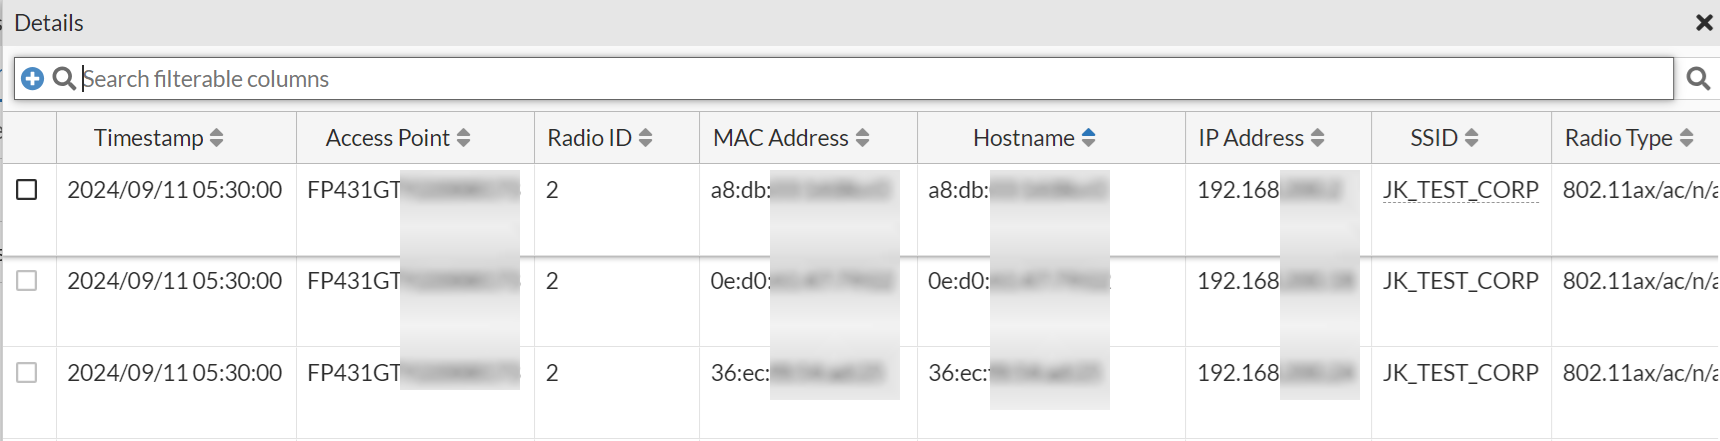
To view details for each of the 3 panels, click on the retries and SNR graphs, or on the OS name to view details. The Details page displays data such as, the host name, access point and radio details, associated SSID, OS type, throughput, noise, retries, and so on.
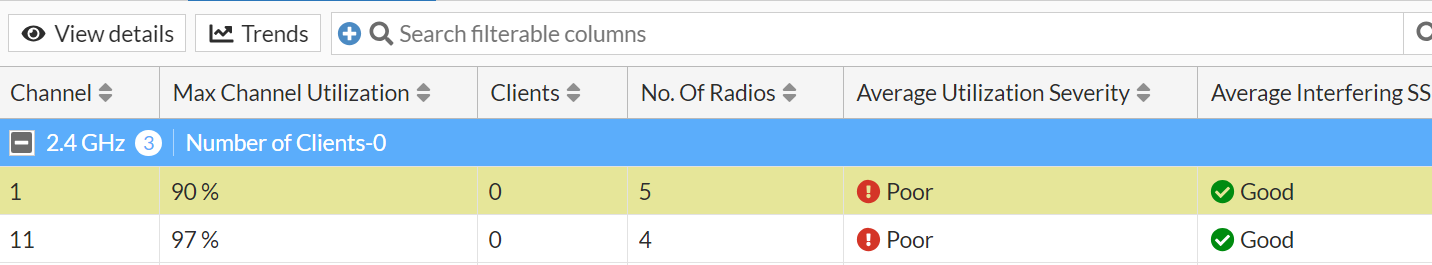
Channel Summary
This page provides granular insights into the performance of each channel with detailed statistics and trends. For more information, see Channel Summary.
Clients
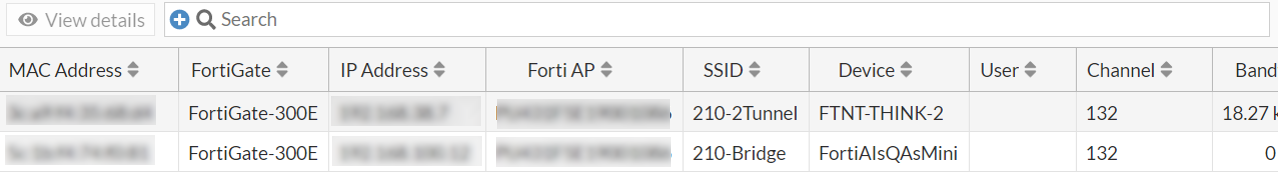
The Clients tab displays a list of clients currently connected to the selected AP, along with details such as the client MAC address, FortiGate and IP Address, FortiAP name , associated SSID, user name , operating channel and the radio details, Tx and Rx bandwidth, signal strength and noise, VLAN ID, RF band, the wireless standard, and the time of association. This information is useful for identifying any clients that may be experiencing connectivity issues or data usage problems. To view detailed information of a client, select the client and click View details.
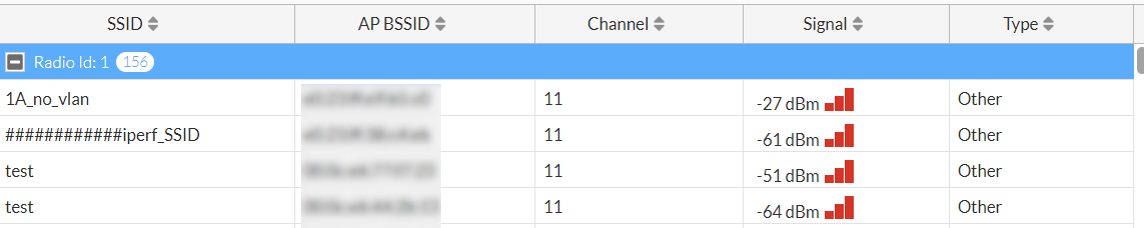
Interfering SSIDs
The Interfering SSIDs tab displays the details of interfering SSIDs associated with an AP; the interfering SSID page displays the associated SSID, related AP BSSID, operating channel, signal strength and the radio details are displayed in the AP dashboard. To view the interfering SSID details, ensure that the AP radio is using Radio Resource Provisioning or a WIDS profile in FortiGate (Managed FortiAP Profile).
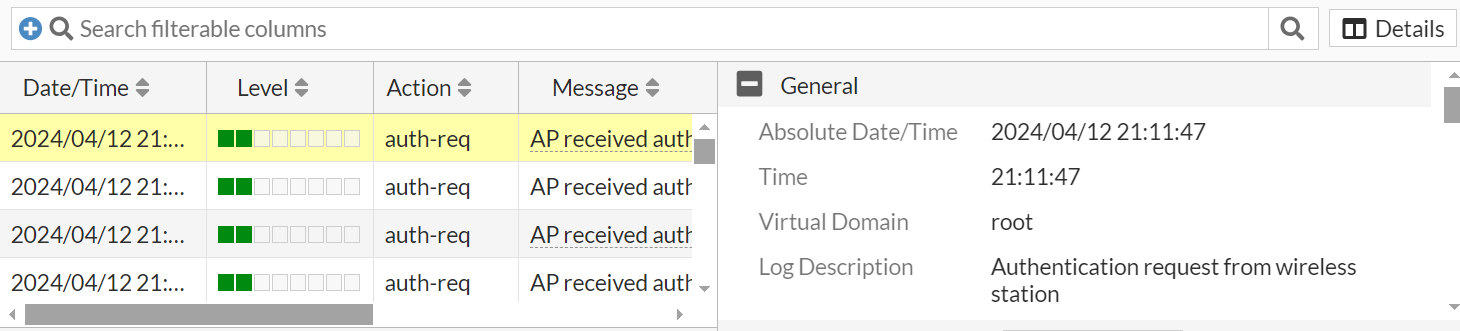
Logs
The Logs tab provides detailed logs of events related to the selected AP/Radio. To view detailed information, select log and click Details.
Spectrum Analysis
Spectrum Analysis tab provides visual spectrum analysis capabilities that scan radios for RF channel conditions and sources of interference which can potentially impact WLAN efficiency. Based on the spectrum analysis data, corrective measures such as determining optimal channel planning, debugging client related connectivity issues and automatic transmit power settings are initiated. This facilitates quality wireless service levels by ensuring the optimal usage of the channels considering the information provided by the FortiAIOps spectrum analyser. Both 802.11 and non-802.11 sources of interference can be detected and analyzed by the spectrum analyzer.
Notes:
-
Spectrum analysis is supported for all channels when the radio is in the dedicated monitor mode, and for selected channels when the radio is in the AP mode.
- FortiAP supports spectrum analysis and is online.
Select the channels to be scanned and configure the scan duration, the spectrum analysis is performed on 2.4 GHz, 5 GHz, and 6 GHZ frequency bands. The spectrum analyzer result displays widgets with the type of interference, signal strength, impacted channels, and wireless spectrum current utilization, start and end time and duration of the interference. It classifies wireless & non-wireless interferences to easy identification of the source.
- You can select the AP, Radio, and Channels to be scanned for interferences.
- The Scan Duration can be set to 1, 5, 30, or 60 minutes.
- The Sampling Interval and the number of Spectrogram Samples cannot be modified.
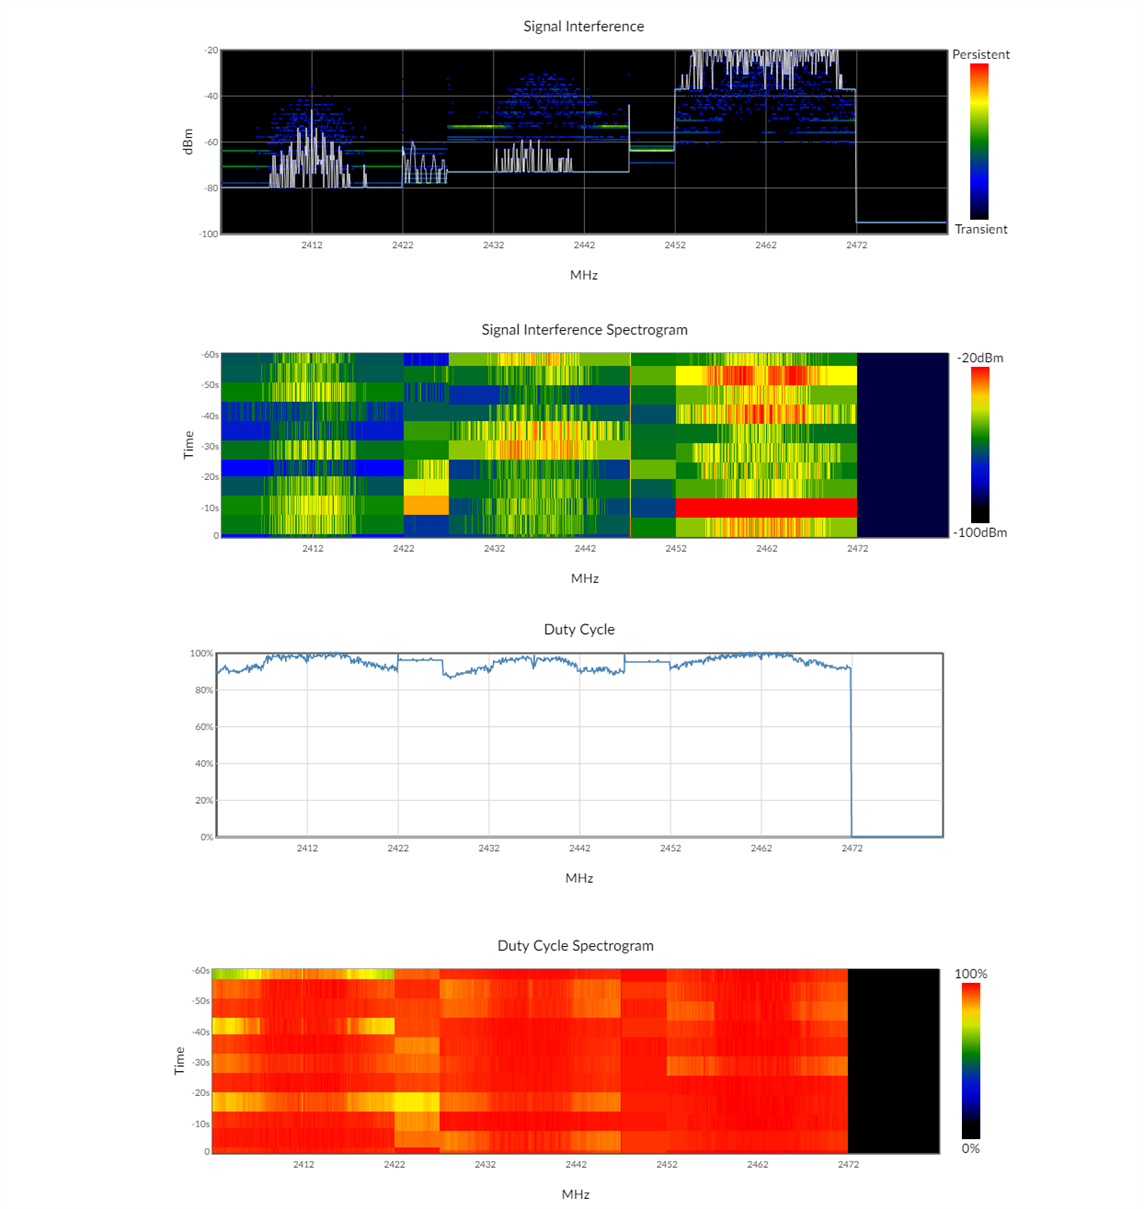
Select Start and the GUI periodically polls the spectrum analysis data based on the fixed sampling interval of 1000 milliseconds. Data is visualized as 4 charts representing signal interference marking the noise levels for each channel, signal interference spectrogram representing 60 samples for different channels at specific time intervals, the duty cycle charts marking the extent to which a non-WiFi device/neighbouring AP is interfering, and the duty cycle spectrogram representing 60 such duty samples for each channel over a period of time.
The tabular data for non-WiFi interference displays the time and frequency of last detection and any of the following type of devices causing the interference.
- Microwave ovens
- Video bridges
- Wi-Fi, DSSS cordless phones
- Bluetooth, FHSS cordless phones
The tabular data for WiFi interference displays the online neighbouring AP's BSSID, SSID, maximum signal strength, and channel and time of last detection.
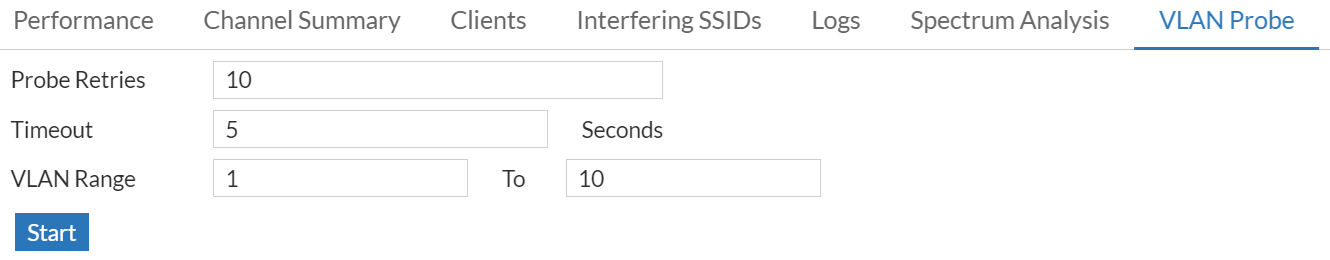
VLAN Probe
VLAN probe tab enables FortiAPs to probe connected VLANs and subnets. It sends DHCP probes from the FortiAP’s Ethernet interface to specific VLANs on the wired interface and returns information on their availability and subnet details. This helps diagnose and troubleshoot WiFi deployment issues.
- Probe Retries – Configure the number of retries before timeout. The valid range is 1 to 10 with a default value of 6.
- Timeout – Configure the timeout for the VLAN probe. The valid range is 1 – 60 seconds with a default value of 10 seconds.
- VLAN Range – Select the range of VLANs to probe. The valid range is 1 - 4094.
Select Start to initiate VLAN probe as per configurations.