
Client Management
The Client Management monitor offers a consolidated, real-time view of individual clients interacting with protected applications, enabling security teams to trace behavior patterns, assess risk levels, and respond to emerging threats with greater precision.
Unlike log-based tools that provide isolated snapshots, this monitor correlates client activity over time—grouping requests by a persistent identifier (Client ID or IP) and enriching them with metadata such as geo-location and device type. This longitudinal perspective makes it easier to distinguish between legitimate users and high-risk behaviors like scraping, brute-force login attempts, or automated reconnaissance.
Whether tuning detection thresholds or investigating false positives, the Client Management dashboard serves as a powerful visibility and diagnostics tool for fine-tuning FortiWeb deployments.
-
Track real-world client behavior: Go beyond individual requests by analyzing how a client’s behavior evolves over time.
-
Surface anomalies: Identify spikes in traffic volume, displays the current geography and device type, and other behavioral shifts that may indicate evasion techniques or automation.
-
Validate detection thresholds: Use average and peak occurrence metrics to calibrate thresholds more accurately for your traffic patterns.
-
Accelerate threat investigations: Quickly filter and inspect high-risk clients based on policy, identification type, or average occurrence.
To view the Client Management data, go to Dashboard > Client Management. If it is not available in the Dashboard menu, refer to Monitors for how to add a monitor.
Dashboard Interface Overview
The Client Management dashboard combines flexible filtering tools, an intuitive display layout, and a choice between table-based and graphical analytics to help administrators focus on what matters.
Top Toolbar

|
Control |
Description |
|---|---|
| Refresh | Reloads all client data currently held in the Redis database. |
| Delete | Removes the selected client record, clearing its session, threat score, and behavioral history. |
| Delete All | Removes all client records, resetting the dashboard. |
| Restore Score | Resets the threat score of a selected client while preserving its behavioral history. |
| Restore All Scores | Resets the threat scores for all clients, allowing reclassification under current conditions. |
Time Range Selection
Choose between 1 day, 3 days, or 7 days of retention to control the data scope for both table and graph views. These settings determine how far back FortiWeb includes client records.
Filter Panel
Click Add Filter to refine the displayed results. Available filter types include:
-
Client ID
-
Geo Location
-
Global Risk Level
-
Identification Type
-
Last Server Policy
-
User Agent
These filters allow you to narrow the view to specific client profiles, attack patterns, or application contexts.
View Mode Toggle
Toggle between:
-
Table View – Presents a detailed list of all tracked clients, including behavioral metadata.
-
Graph View – Provides FortiView visualizations for trend analysis across the full set of observed clients.
The two views are fully integrated—use Table View for drilling into specific records and Graph View for high-level behavioral insights.
Table View
The Table View provides a detailed breakdown of every tracked client, correlating real-time and historical data to help identify threat patterns, client anomalies, and detection performance. Each row represents a unique client, indexed by Client ID, and includes metadata that reflects the client’s behavioral profile and risk level.
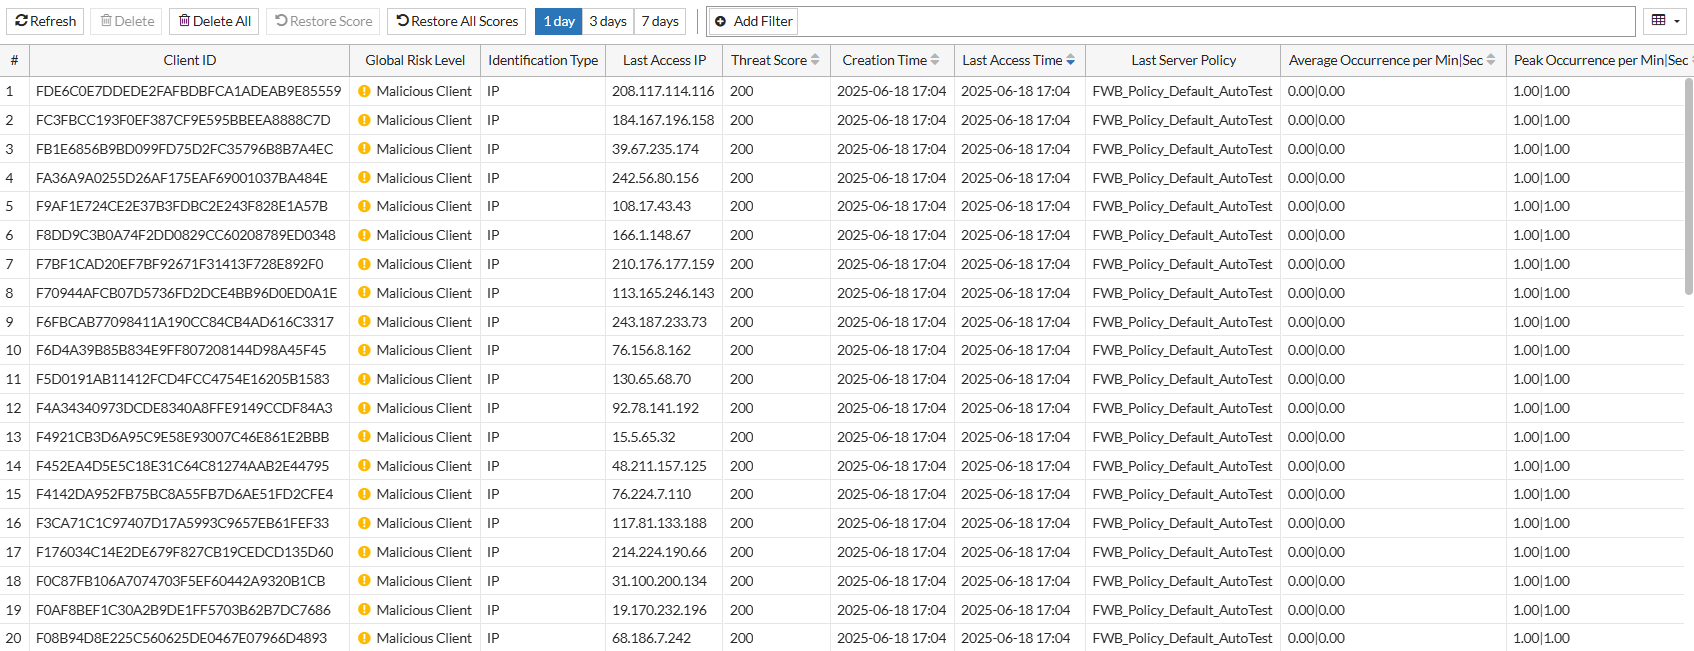
Column Descriptions
|
Column Name |
Description |
|---|---|
| # | Index number for the client record. |
| Client ID | Unique identifier assigned to the client. |
| Global Risk Level | Current threat classification level based on observed behavior. |
| Identification Type | Method used to identify the client (e.g., IP, cookie-based ID). |
| Last Access IP | Most recent source IP address associated with the client. |
| Threat Score | Cumulative threat score based on matched detection criteria. |
|
Signature Score |
Reflects the cumulative threat score based on signature violations associated with the Client ID. This column is hidden by default. |
| Creation Time | Timestamp when the client ID was first recorded. |
|
Last Access Time |
Most recent timestamp of any activity from this client. |
|
Last Server Policy |
The last server policy accessed by this client. |
|
Average Occurrence per Min|Sec |
Moving average of how frequently the client has sent requests, calculated separately for each time scale using recent traffic data. Useful for establishing normal behavioral baselines. |
|
Peak Occurrence per Min|Sec |
Highest recorded number of requests from the client in a single minute or second. Useful for identifying sudden request bursts or scripted behavior. |
|
Geo Location |
Current country associated with the client. |
| User Agent | Current user-agent strings and types. |
Use the filter panel to dynamically narrow the client set shown in this table. For example, you can isolate clients using a mobile browser from unknown locations with above-average peak request rates.
Graph View
The Graph View offers a visual summary of client activity trends across the entire observed dataset. This view is optimized for identifying traffic patterns, geographical anomalies, and behavioral outliers at scale.
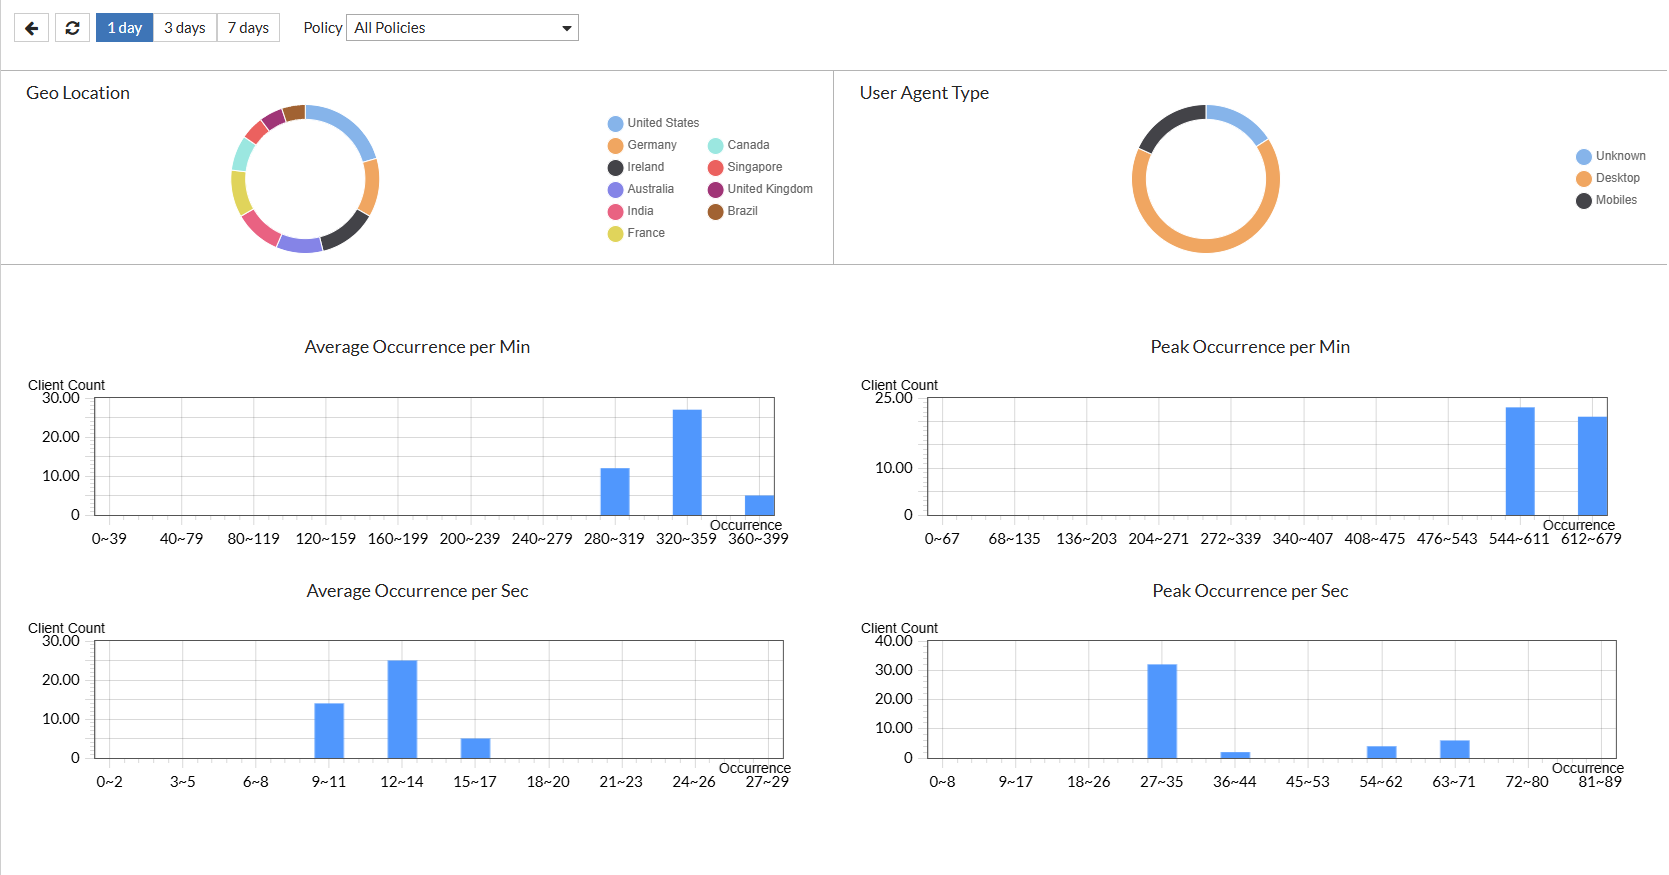
Visualizations
|
Category |
Visualization Type |
Description |
|---|---|---|
| Geo Location | Pie chart | Shows the geographic distribution of clients based on the most recent location data. Shows the top 10 countries |
|
User Agent Type |
Pie chart |
Displays the distribution of user agent types, categorized as Desktop, Mobile, or Unrecognized. |
| Average Occurrence per Min | Bar chart | Displays the total number of clients found in the range of the occurrence frequency (per minute). This helps identify typical request frequency across clients over one-minute windows. |
| Average Occurrence per Sec | Bar chart | Displays the total number of clients found in the range of the occurrence frequency (per second). High values may indicate scripted or automated behavior. |
| Peak Occurrence per Min | Bar chart | Displays the highest request spikes per client found in the range of the occurrence frequency (per minute). This is useful for flagging potential DDoS-like behavior. |
| Peak Occurrence per Sec | Bar chart | Displays the highest request spikes per client found in the range of the occurrence frequency (per second). This helps detect sudden, high-intensity request bursts at the subminute level. |
This view is particularly useful when monitoring newly observed clients, tracking botnet behavior, or validating the effectiveness of detection thresholds across user segments.