Detections context
The Detections Context page allows you to view detections and observations for a device within a specified time range, and provides detailed insights that includes a timeline, detections, and behavioral observations tables. You can use this page to filter, mute, or exclude devices, and navigate to detailed information pages.
|
|
The device timeline only supports detections that are less than a year old. |
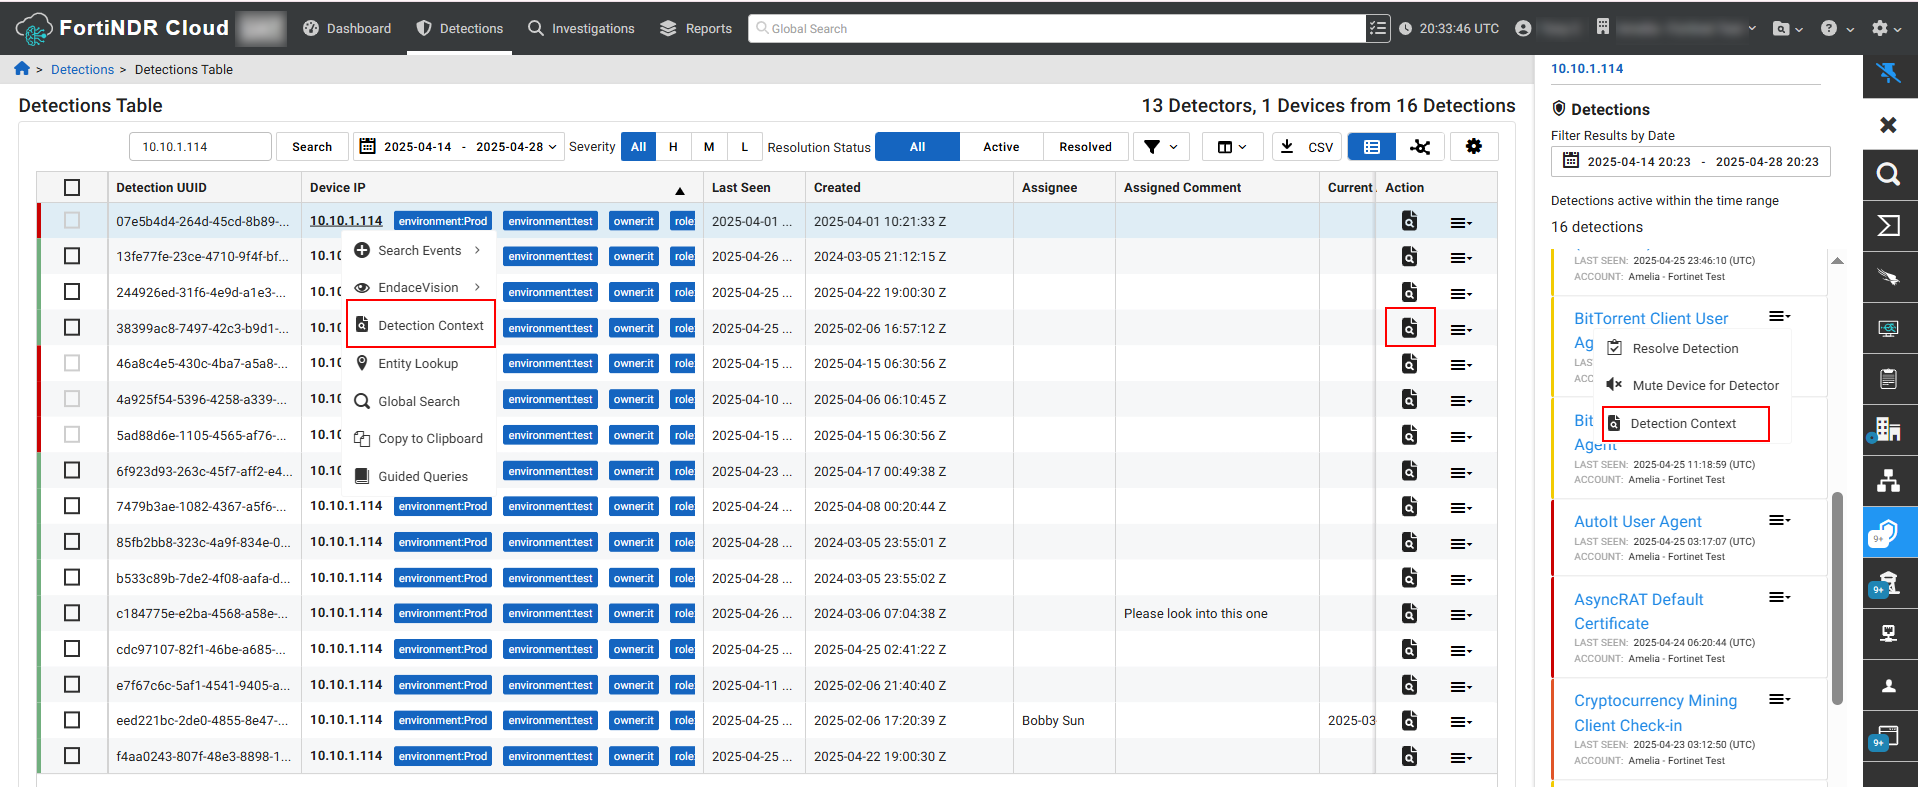
You can pivot to the Detection Context page from any page that displays an IP address, this includes:
- Detections Table:
- Right-click an IP that was last seen within the year and select Detections Context.
- Right-click the Indicators column.
- Click the Detections Context icon in the Actions column.
- Click the Actions menu in the Entity Panel and select Detections Context.
- The Events table > Investigation results page. Note that the page will not display a selected detection because you are pivoting from an event.
- The Private Search page.
- The Triage Detection page > Events tab.
- Detections details > Lifetime Events column.
- The Behavioral Observations details page
- The Aggregation table including the table in a report. When you pivot from the Aggregation table in a report, the Detection Context page will always show the last 90 days.
- The Entity lookup table. This includes the Entity Lookup table in Global Search results.
- The Manage Annotations page. This is limited to valid IPs for the last 90 days.
- The Entity Panel. You can pivot to the Detection Context page when the Entity Panel title is an IP address.
- Detections Table > Indicators column.
Detection context page
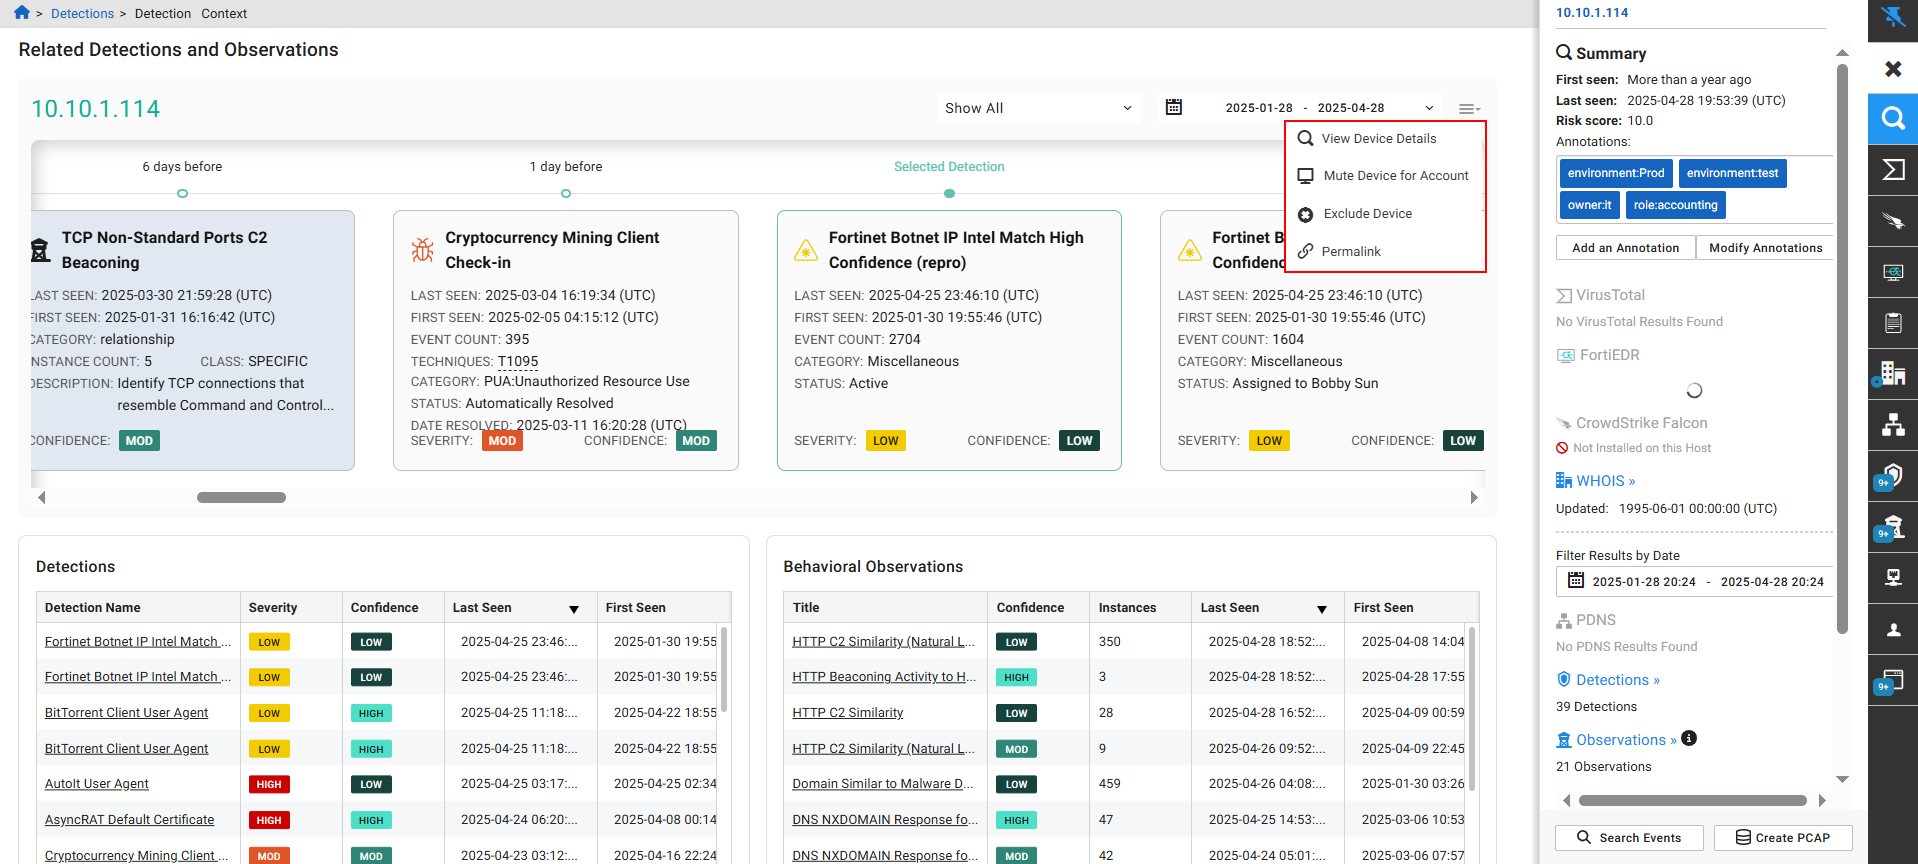
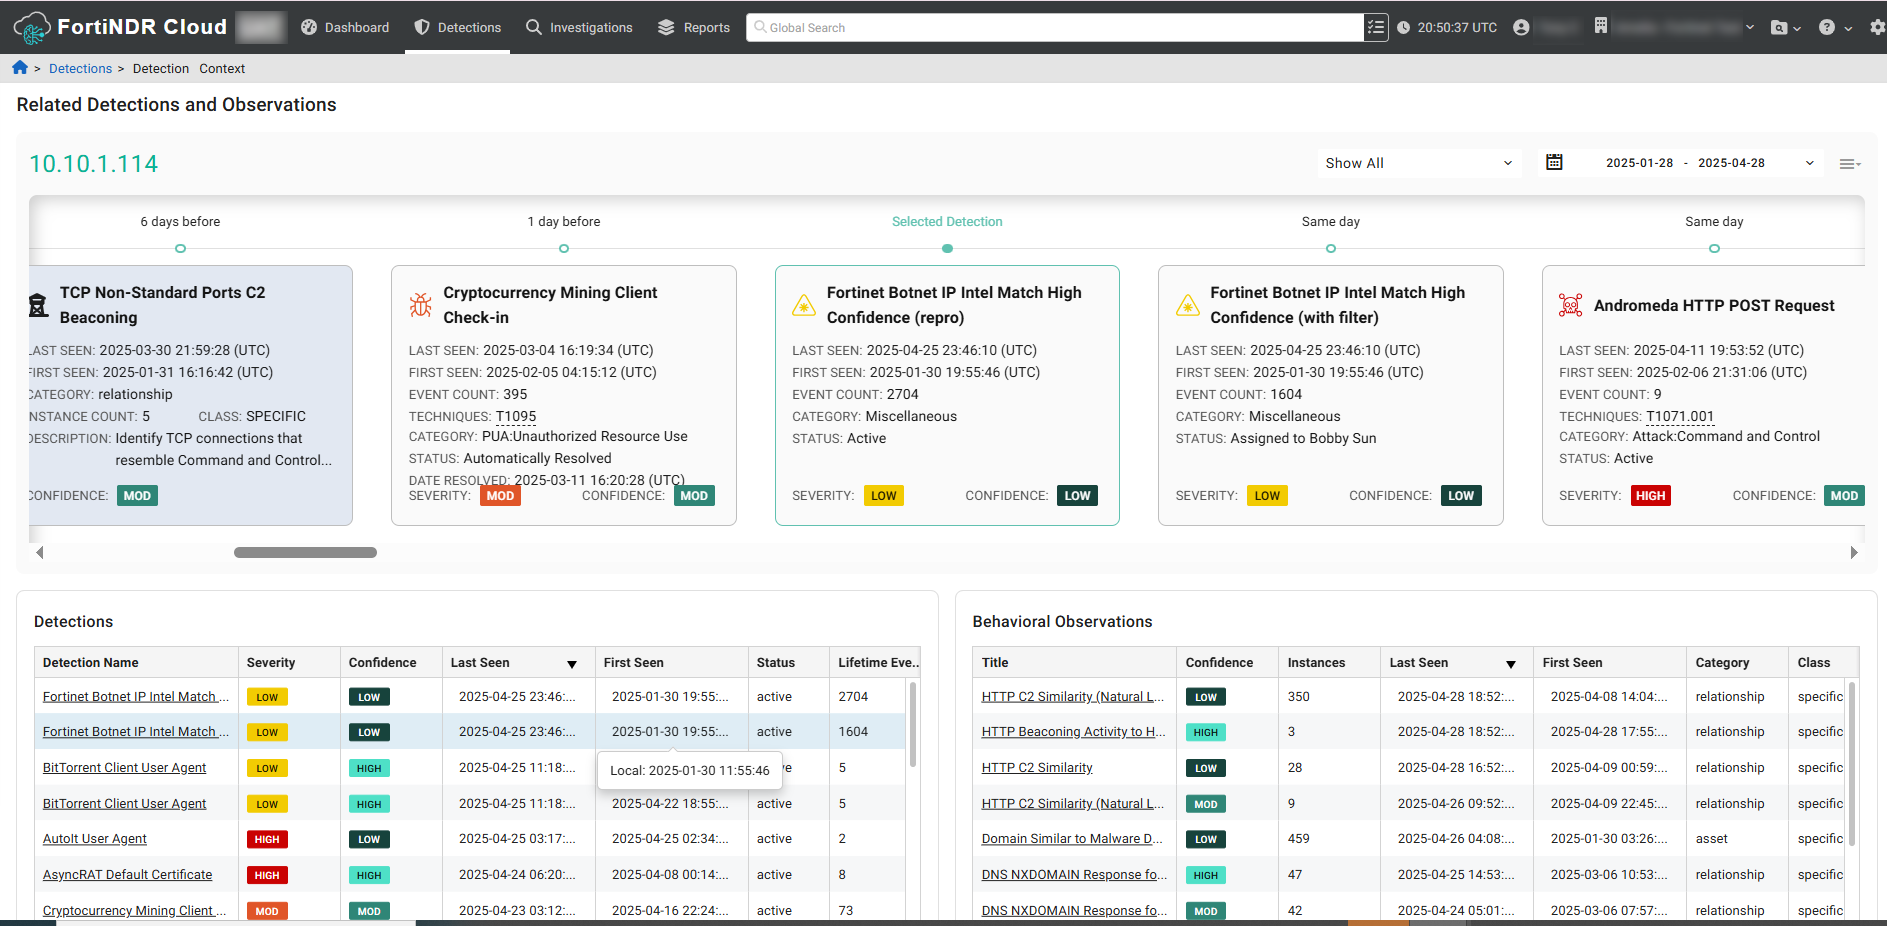
The Detection Context page displays the detections and observations timeline, as well as Detections and Behavioral Observations tables. The tables are sorted by Last Seen in descending order. The Detection Context page will display a message indicating that there are no detections or observations when none are present.
The detection you pivoted from in the Detections table will appear as the Selected Detection in the center of the timeline and display details about the detection. The timeline is sorted by Last Seen in ascending order. To change the Selected Detection, click a row in the Detections table. To change the selection to an observation, click a row in the Behavioral Observations table. You can also use the scroll bar to navigate back and forth in the timeline.
To pivot to the Detections or Behavioral Observations pages, click the Detection Name or observation Title in the table, or click a tile in the timeline.
To view the Entity Panel for the device, click the IP address at the top-left side of the page or click the Actions menu next to the date picker and select View Device Details. You can use this menu to Mute Device for Account, Exclude Device and copy the device Permalink.