Fortinet white logo
Fortinet white logo

Administration Guide

Link health monitor

Link health monitor

Performance SLA link health monitoring measures the health of links that are connected to SD-WAN member interfaces by either sending probing signals through each link to a server, or using session information that is captured on firewall policies (see Passive WAN health measurement for information), and measuring the link quality based on latency, jitter, and packet loss. If a link fails all of the health checks, the routes on that link are removed from the SD-WAN link load balancing group, and traffic is routed through other links. When the link is working again the routes are reestablished. This prevents traffic being sent to a broken link and lost.

When an SD-WAN member has multiple health checks configured, all of the checks must fail for the routes on that link to be removed from the SD-WAN link load balancing group.

Two health check servers can be configured to ensure that, if there is a connectivity issue, the interface is at fault and not the server. A server can only be used in one health check.

The FortiGate uses the first server configured in the health check server list to perform the health check. If the first server is unavailable, then the second server is used. The second server continues to be used until it becomes unavailable, and then the FortiGate returns to the first server, if it is available. If both servers are unavailable, then the health check fails.

You can configure the protocol that is used for status checks, including: Ping, HTTP, HTTPS. DNS, TCP echo, UDP echo, two-way active measurement protocol (TWAMP), TCP connect, and FTP. In the GUI, only Ping, HTTP, and DNS are available.

You can view link quality measurements by going to Network > SD-WAN and selecting the Performance SLAs tab. The table shows the default health checks, the health checks that you configured, and information about each health check. The values shown in the Packet Loss, Latency, and Jitter columns are for the health check server that the FortiGate is currently using. The green up arrows indicate that the server is responding, and does not indicate if the health checks are being met. See Results for more information.

To configure a link health monitor in the GUI:
  1. Go to Network > SD-WAN, select the Performance SLAs tab, and click Create New.

  2. Set a Name for the SLA.

  3. If enabled in Feature Visibility, set the IP Version. IPv6 does not support all of the protocols.

  4. Set the Probe mode:

    • Active: Send probes to determine link quality.

    • Passive: Use traffic to determine link quality. Enable passive health checks in policies to allow measurement.

    • Prefer Passive: Same as passive mode, but send probes when there is no traffic.

  5. Set the Protocol that you need to use for status checks: Ping, HTTP, or DNS.

  6. Set Server to the IP addresses of up to two servers that all of the SD-WAN members in the performance SLA can reach. If the Protocol is DNS, set the DNS Server to either the same as the system DNS, or specify the primary and secondary DNS servers.

  7. Set Participants to All SD-WAN Members, or select Specify to choose specific SD-WAN members.

  8. Set Enable probe packets to enable or disable sending probe packets.

  9. Configure SLA Target:

    If the health check is used in an SD-WAN rule that uses Manual or Best Quality strategies, enabling SLA Target is optional. If the health check is used in an SD-WAN rule that uses Lowest Cost (SLA) or Maximum Bandwidth (SLA) strategies, then SLA Target is enabled.

    When SLA Target is enabled, configure the following:

    • Latency threshold: Calculated based on last 30 probes (default = 5ms).

    • Jitter threshold: Calculated based on last 30 probes (default = 5ms).

    • Packet Loss threshold: Calculated based on last 100 probes (default = 0%).

  10. In the Link Status section configure the following:

    • Check interval: the interval in which the FortiGate checks the interface, in milliseconds (20 - 3600000, default = 500).

    • Failures before inactive: The number of failed status checks before the interface shows as inactive (1 - 3600, default =5). This setting helps prevent flapping, where the system continuously transfers traffic back and forth between links

    • Restore link after: The number of successful status checks before the interface shows as active (1 - 3600, default = 5). This setting helps prevent flapping, where the system continuously transfers traffic back and forth between links

  11. In the Actions when Inactive section, enable Update static route to disable static routes for inactive interfaces and restore routes when interfaces recover.
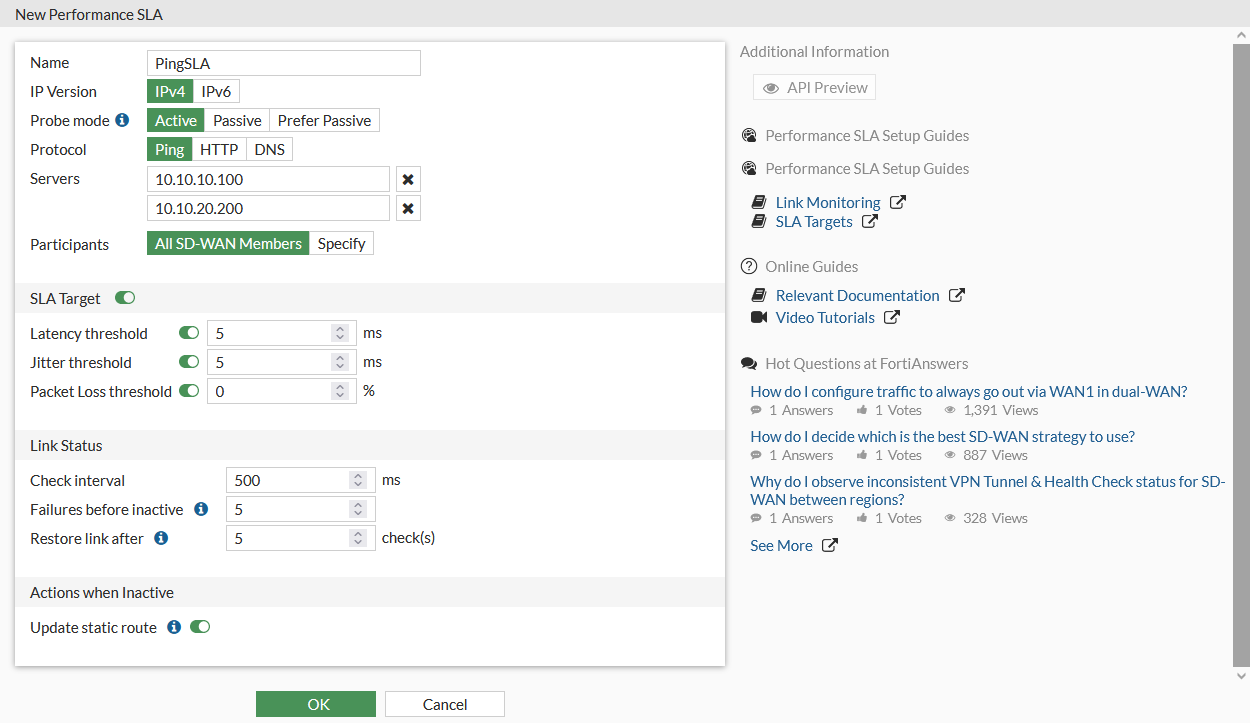
  12. Click OK.

To configure a link health monitor in the CLI:
config system sdwan
    config health-check
        edit "PingSLA"
            set addr-mode {ipv4 | ipv6}
            set server <server1_IP_address> <server2_IP_address>
            set detect-mode {active | passive | prefer-passive}
            set protocol {ping | tcp-echo | udp-echo | http | https| twamp | dns | tcp-connect | ftp}
            set ha-priority <integer>
            set probe-timeout <integer>
            set probe-count <integer>
            set probe-packets {enable | disable}
            set interval <integer>
            set failtime <integer>
            set recoverytime <integer>
            set diffservcode <binary>
            set update-static-route {enable | disable}
            set update-cascade-interface {enable | disable}
            set sla-fail-log-period <integer>
            set sla-pass-log-period <integer>
            set threshold-warning-packetloss <integer>
            set threshold-alert-packetloss <integer>
            set threshold-warning-latency <integer>
            set threshold-alert-latency <integer>
            set threshold-warning-jitter <integer>
            set threshold-alert-jitter <integer>
            set vrf <integer>
            set source <ip address>
            set members <member_number> ... <member_number>
            config sla
                edit 1
                    set link-cost-factor {latency jitter packet-loss}
                    set latency-threshold <integer>
                    set jitter-threshold <integer>
                    set packetloss-threshold <integer>
                next
            end
        next
    end
end

Additional settings are available for some of the protocols:

Protocol

Additional options

http, https

port <port_number>
http-get <url>
http-agent <string>
http-match <response_string>

twamp

port <port_number>
security mode {none | authentication}
password <password>
packet-size <size>

ftp

ftp-mode {passive | port}
ftp-file <path>

For more examples see Protocol.

Link health monitor

Link health monitor

Performance SLA link health monitoring measures the health of links that are connected to SD-WAN member interfaces by either sending probing signals through each link to a server, or using session information that is captured on firewall policies (see Passive WAN health measurement for information), and measuring the link quality based on latency, jitter, and packet loss. If a link fails all of the health checks, the routes on that link are removed from the SD-WAN link load balancing group, and traffic is routed through other links. When the link is working again the routes are reestablished. This prevents traffic being sent to a broken link and lost.

When an SD-WAN member has multiple health checks configured, all of the checks must fail for the routes on that link to be removed from the SD-WAN link load balancing group.

Two health check servers can be configured to ensure that, if there is a connectivity issue, the interface is at fault and not the server. A server can only be used in one health check.

The FortiGate uses the first server configured in the health check server list to perform the health check. If the first server is unavailable, then the second server is used. The second server continues to be used until it becomes unavailable, and then the FortiGate returns to the first server, if it is available. If both servers are unavailable, then the health check fails.

You can configure the protocol that is used for status checks, including: Ping, HTTP, HTTPS. DNS, TCP echo, UDP echo, two-way active measurement protocol (TWAMP), TCP connect, and FTP. In the GUI, only Ping, HTTP, and DNS are available.

You can view link quality measurements by going to Network > SD-WAN and selecting the Performance SLAs tab. The table shows the default health checks, the health checks that you configured, and information about each health check. The values shown in the Packet Loss, Latency, and Jitter columns are for the health check server that the FortiGate is currently using. The green up arrows indicate that the server is responding, and does not indicate if the health checks are being met. See Results for more information.

To configure a link health monitor in the GUI:
  1. Go to Network > SD-WAN, select the Performance SLAs tab, and click Create New.

  2. Set a Name for the SLA.

  3. If enabled in Feature Visibility, set the IP Version. IPv6 does not support all of the protocols.

  4. Set the Probe mode:

    • Active: Send probes to determine link quality.

    • Passive: Use traffic to determine link quality. Enable passive health checks in policies to allow measurement.

    • Prefer Passive: Same as passive mode, but send probes when there is no traffic.

  5. Set the Protocol that you need to use for status checks: Ping, HTTP, or DNS.

  6. Set Server to the IP addresses of up to two servers that all of the SD-WAN members in the performance SLA can reach. If the Protocol is DNS, set the DNS Server to either the same as the system DNS, or specify the primary and secondary DNS servers.

  7. Set Participants to All SD-WAN Members, or select Specify to choose specific SD-WAN members.

  8. Set Enable probe packets to enable or disable sending probe packets.

  9. Configure SLA Target:

    If the health check is used in an SD-WAN rule that uses Manual or Best Quality strategies, enabling SLA Target is optional. If the health check is used in an SD-WAN rule that uses Lowest Cost (SLA) or Maximum Bandwidth (SLA) strategies, then SLA Target is enabled.

    When SLA Target is enabled, configure the following:

    • Latency threshold: Calculated based on last 30 probes (default = 5ms).

    • Jitter threshold: Calculated based on last 30 probes (default = 5ms).

    • Packet Loss threshold: Calculated based on last 100 probes (default = 0%).

  10. In the Link Status section configure the following:

    • Check interval: the interval in which the FortiGate checks the interface, in milliseconds (20 - 3600000, default = 500).

    • Failures before inactive: The number of failed status checks before the interface shows as inactive (1 - 3600, default =5). This setting helps prevent flapping, where the system continuously transfers traffic back and forth between links

    • Restore link after: The number of successful status checks before the interface shows as active (1 - 3600, default = 5). This setting helps prevent flapping, where the system continuously transfers traffic back and forth between links

  11. In the Actions when Inactive section, enable Update static route to disable static routes for inactive interfaces and restore routes when interfaces recover.

  12. Click OK.

To configure a link health monitor in the CLI:
config system sdwan
    config health-check
        edit "PingSLA"
            set addr-mode {ipv4 | ipv6}
            set server <server1_IP_address> <server2_IP_address>
            set detect-mode {active | passive | prefer-passive}
            set protocol {ping | tcp-echo | udp-echo | http | https| twamp | dns | tcp-connect | ftp}
            set ha-priority <integer>
            set probe-timeout <integer>
            set probe-count <integer>
            set probe-packets {enable | disable}
            set interval <integer>
            set failtime <integer>
            set recoverytime <integer>
            set diffservcode <binary>
            set update-static-route {enable | disable}
            set update-cascade-interface {enable | disable}
            set sla-fail-log-period <integer>
            set sla-pass-log-period <integer>
            set threshold-warning-packetloss <integer>
            set threshold-alert-packetloss <integer>
            set threshold-warning-latency <integer>
            set threshold-alert-latency <integer>
            set threshold-warning-jitter <integer>
            set threshold-alert-jitter <integer>
            set vrf <integer>
            set source <ip address>
            set members <member_number> ... <member_number>
            config sla
                edit 1
                    set link-cost-factor {latency jitter packet-loss}
                    set latency-threshold <integer>
                    set jitter-threshold <integer>
                    set packetloss-threshold <integer>
                next
            end
        next
    end
end

Additional settings are available for some of the protocols:

Protocol

Additional options

http, https

port <port_number>
http-get <url>
http-agent <string>
http-match <response_string>

twamp

port <port_number>
security mode {none | authentication}
password <password>
packet-size <size>

ftp

ftp-mode {passive | port}
ftp-file <path>

For more examples see Protocol.