
FortiAnalyzer event handler trigger
You can trigger automation stitches based on FortiAnalyzer event handlers. This allows you to define rules based on complex correlations across devices, log types, frequencies, and other criteria.
To set up a FortiAnalyzer event handler trigger:
Configure a FortiGate event handler on the FortiAnalyzer
On the FortiAnalyzer, configure an event handler for the automation stitch. In this example, the event handler is triggered by two or more invalid log in attempts to the FortiGate in less than one minute. See Creating a custom event handler in the FortiAnalyzer Administration Guide for more information.
To configure an event handler on the FortiAnalyzer:
-
Go to Incidents & Events > Handlers, select the Basic Handlers tab, and click Create New.
-
Set Name to log-handler.
-
Enable Automation Stitch.
-
Click Add New Rule and configure a rule with two conditions:
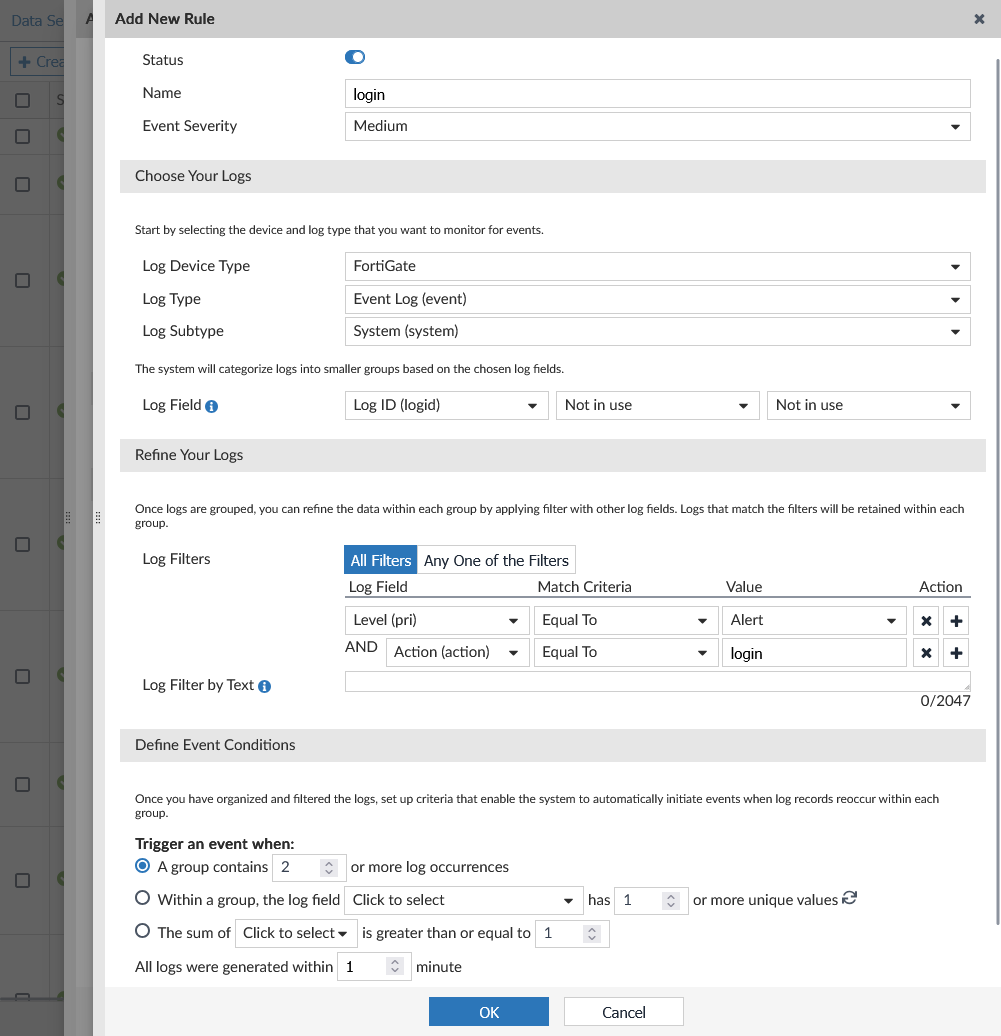
Field
Value
Name
login
Event Severity
Medium
Log Device Type
FortiGate
Log Type
Event Log (event)
Log Subtype
System (system)
Log Field
Log ID (logid)
Log Filters
All Filters
Log Field
Level (pri)
Match Criteria
Equal To
Value
Alert
Log Field
Action (action)
Match Criteria
Equal To
Value
login
Trigger an event when
A group contains 2 or more log occurrences
All logs were generated within 1 minute
Tags
(Optional) InvalidLogin
-
Configure the other settings as needed then click OK.
-
Click OK.
Configure FortiAnalyzer logging on the FortiGate
See Configuring FortiAnalyzer for more information.
To configure FortiAnalyzer logging:
-
On the FortiGate, go to Security Fabric > Fabric Connectors, double-click the Logging & Analytics card, and go to the FortiAnalyzer tab.
-
Check that the Status is Enabled.
-
Set Server to the IP address of the FortiAnalyzer.
-
Set Upload option as needed.
-
Click OK and accept the FortiAnalyzer certificate.
-
On the FortiAnalyzer, authorize the FortiGate. See Unauthorized devices in the FortiAnalyzer Administration Guide
Configure an automation stitch that is triggered by a FortiAnalyzer event handler
When a FortiAnalyzer event handler is triggered, it sends a notification to the FortiGate automation framework, which generates a log and triggers the automation stitch.
To configure an automation stitch that is triggered by a FortiAnalyzer event handler in the GUI:
-
Go to Security Fabric > Automation and click Create New.
-
Enter the stitch name, auto-faz-1.
-
Configure the trigger:
-
Click Add Trigger.
-
Click Create and select FortiAnalyzer Event Handler.
-
Enter the following:
Name
auto-faz-1
Event handler name
log-handler
Event severity
Medium
Event tag
Optional. Enter only if you have specified a custom tag for the event handler.
In this case, set to InvalidLogin.
-
Click OK.
-
Select the trigger in the list and click Apply.
-
-
Configure the Email notification action:
-
Click Add Action.
-
Click Create and select Email.
-
Enter the following:
Name
auto-faz-1_email
To
Enter an email address
Subject
CSF stitch alert
Body
User login FortiGate failed attempts %%log%%
-
Click OK.
-
Select the action in the list and click Apply.
-
-
Click OK.
To configure an automation stitch that is triggered by a FortiAnalyzer event handler in the CLI:
-
Create an automation trigger:
config system automation-trigger edit "auto-faz-1" set event-type faz-event set faz-event-name "log-handler" set faz-event-severity "medium" set faz-event-tags "InvalidLogin" next end -
Create an automation action:
config system automation-action edit "auto-faz-1_email" set action-type email set email-to "tsmith@ztnademo.com" set email-subject "CSF stitch alert" set message "User login FortiGate failed attempts %%log%%" next end -
Create the automation stitch:
config system automation-stitch
    edit "auto-faz-1"
        set trigger "auto-faz-1"
        config actions
            edit 1
                set action "auto-faz-1_email"
                set required enable
            next
        end
    next
end
View the trigger event log
To view the trigger event log:
-
Attempt to log in to the FortiGate with the wrong password twice in a row.
-
Check that two system logs with severity Alert are generated on the FortiGate:
# execute log filter field subtype system # execute log filter category event # execute log display ... 11: date=2025-06-06 time=11:59:14 eventtime=1749236354989858133 tz="-0700" logid="0100032002" type="event" subtype="system" level="alert" vd="root" logdesc="Admin login failed" sn="0" user="admin" ui="https(172.16.7.254)" method="https" srcip=172.16.7.254 dstip=172.16.7.1 action="login" status="failed" reason="passwd_invalid" msg="Administrator admin login failed from https(172.16.7.254) because of invalid password" 12: date=2025-06-06 time=11:59:12 eventtime=1749236352450280347 tz="-0700" logid="0100032002" type="event" subtype="system" level="alert" vd="root" logdesc="Admin login failed" sn="0" user="admin" ui="https(172.16.7.254)" method="https" srcip=172.16.7.254 dstip=172.16.7.1 action="login" status="failed" reason="passwd_invalid" msg="Administrator admin login failed from https(172.16.7.254) because of invalid password" -
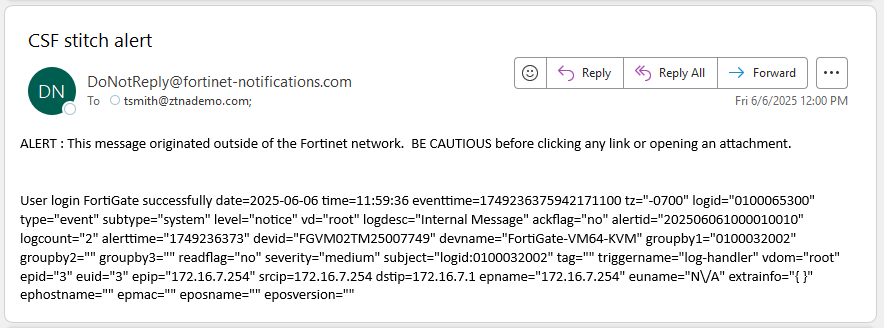
This triggers an event on the FortiAnalyzer that sends a notification to the FortiGate automation framework:
# diagnose debug application autod -1
# diagnose debug enable
__handle_req_body()-109: subscriber update: name subscr-node msg_type 0 msg_len 309:
{"format":0,"category_filter":2,"free_style":[{"category":"event","filter":"(logid 0100022040 0100065304 0100022041 0100065305 0100022042 0100065306 0100022043 0100022044 0100022045 0100022901 0100022902 0100022903 0100022808 0100022809 0100053400 0100053401 0100026004 0100065311)","filter_type":"include"}]}

pid:2086-__handle_msg()-414: Subscriber:4 received package. pubid:0 pkgid:97 pkg_index:0
pid:2086-__handle_pkg_logs()-356: Subscriber:4 processing package size:1512 logs:1 pickup:1
pid:2086-__subscr_close_cur_pkg()-140: close package size:1512 logs:1
__action_email_hdl()-190: email action (auto-faz-1_email) is called.
from:
to:tsmith@ztnademo.com;
subject:CSF stitch alert
An alert email is sent out and an automation stitch log is generated. The email sent by the action will look similar to the following:
-
To view the log in the GUI, go to Log & Report > System Events, select General System Events, and from the log location dropdown select FortiAnalyzer.
-
To view the trigger event log in the CLI:
# execute log display
    ...
9: date=2025-06-06 time=11:59:37 eventtime=1749236376747950301 tz="-0700" logid="0100046600" type="event" subtype="system" level="notice" vd="root" logdesc="Automation stitch triggered" stitch="auto-faz-1" trigger="auto-faz-1" stitchaction="auto-faz-1_email" from="log" msg="stitch:auto-faz-1 is triggered.