


SD-WAN Table view
When Table View is selected, all devices in the network are displayed in a table format. This gives you a quick snapshot of link performance across all devices. Like Monitor Map view, interface colors represent the status of a given interface, according to its performance SLA. Hovering over a given performance SLA, you can see more granular detail about how that SLA is performing according to its configuration.
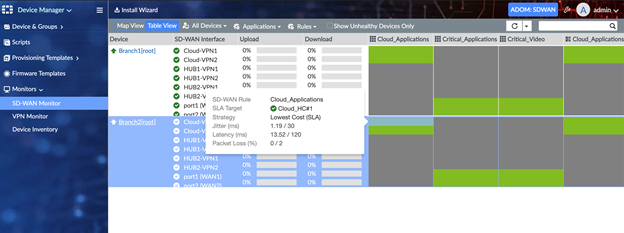
- Green Indicators: all performance SLAs for the given interface are being met.
- Yellow: one of more performance SLAs is not currently meeting minimum requirements.
- Red: one of more performance SLAs is down or unreachable.