


Monitoring and reporting
As detailed earlier in this document, FortiAnalyzer and FortiManager are tools we can use to monitor and manage our SD-WAN and SD-Branch devices from a single pane of glass. FortiManager is used for operational features, while the FortiAnalyzer provides deeper analytics and reporting. When FortiAnalyzer is integrated with FortiManager, you can use a single pane of glass for your network and security operations.
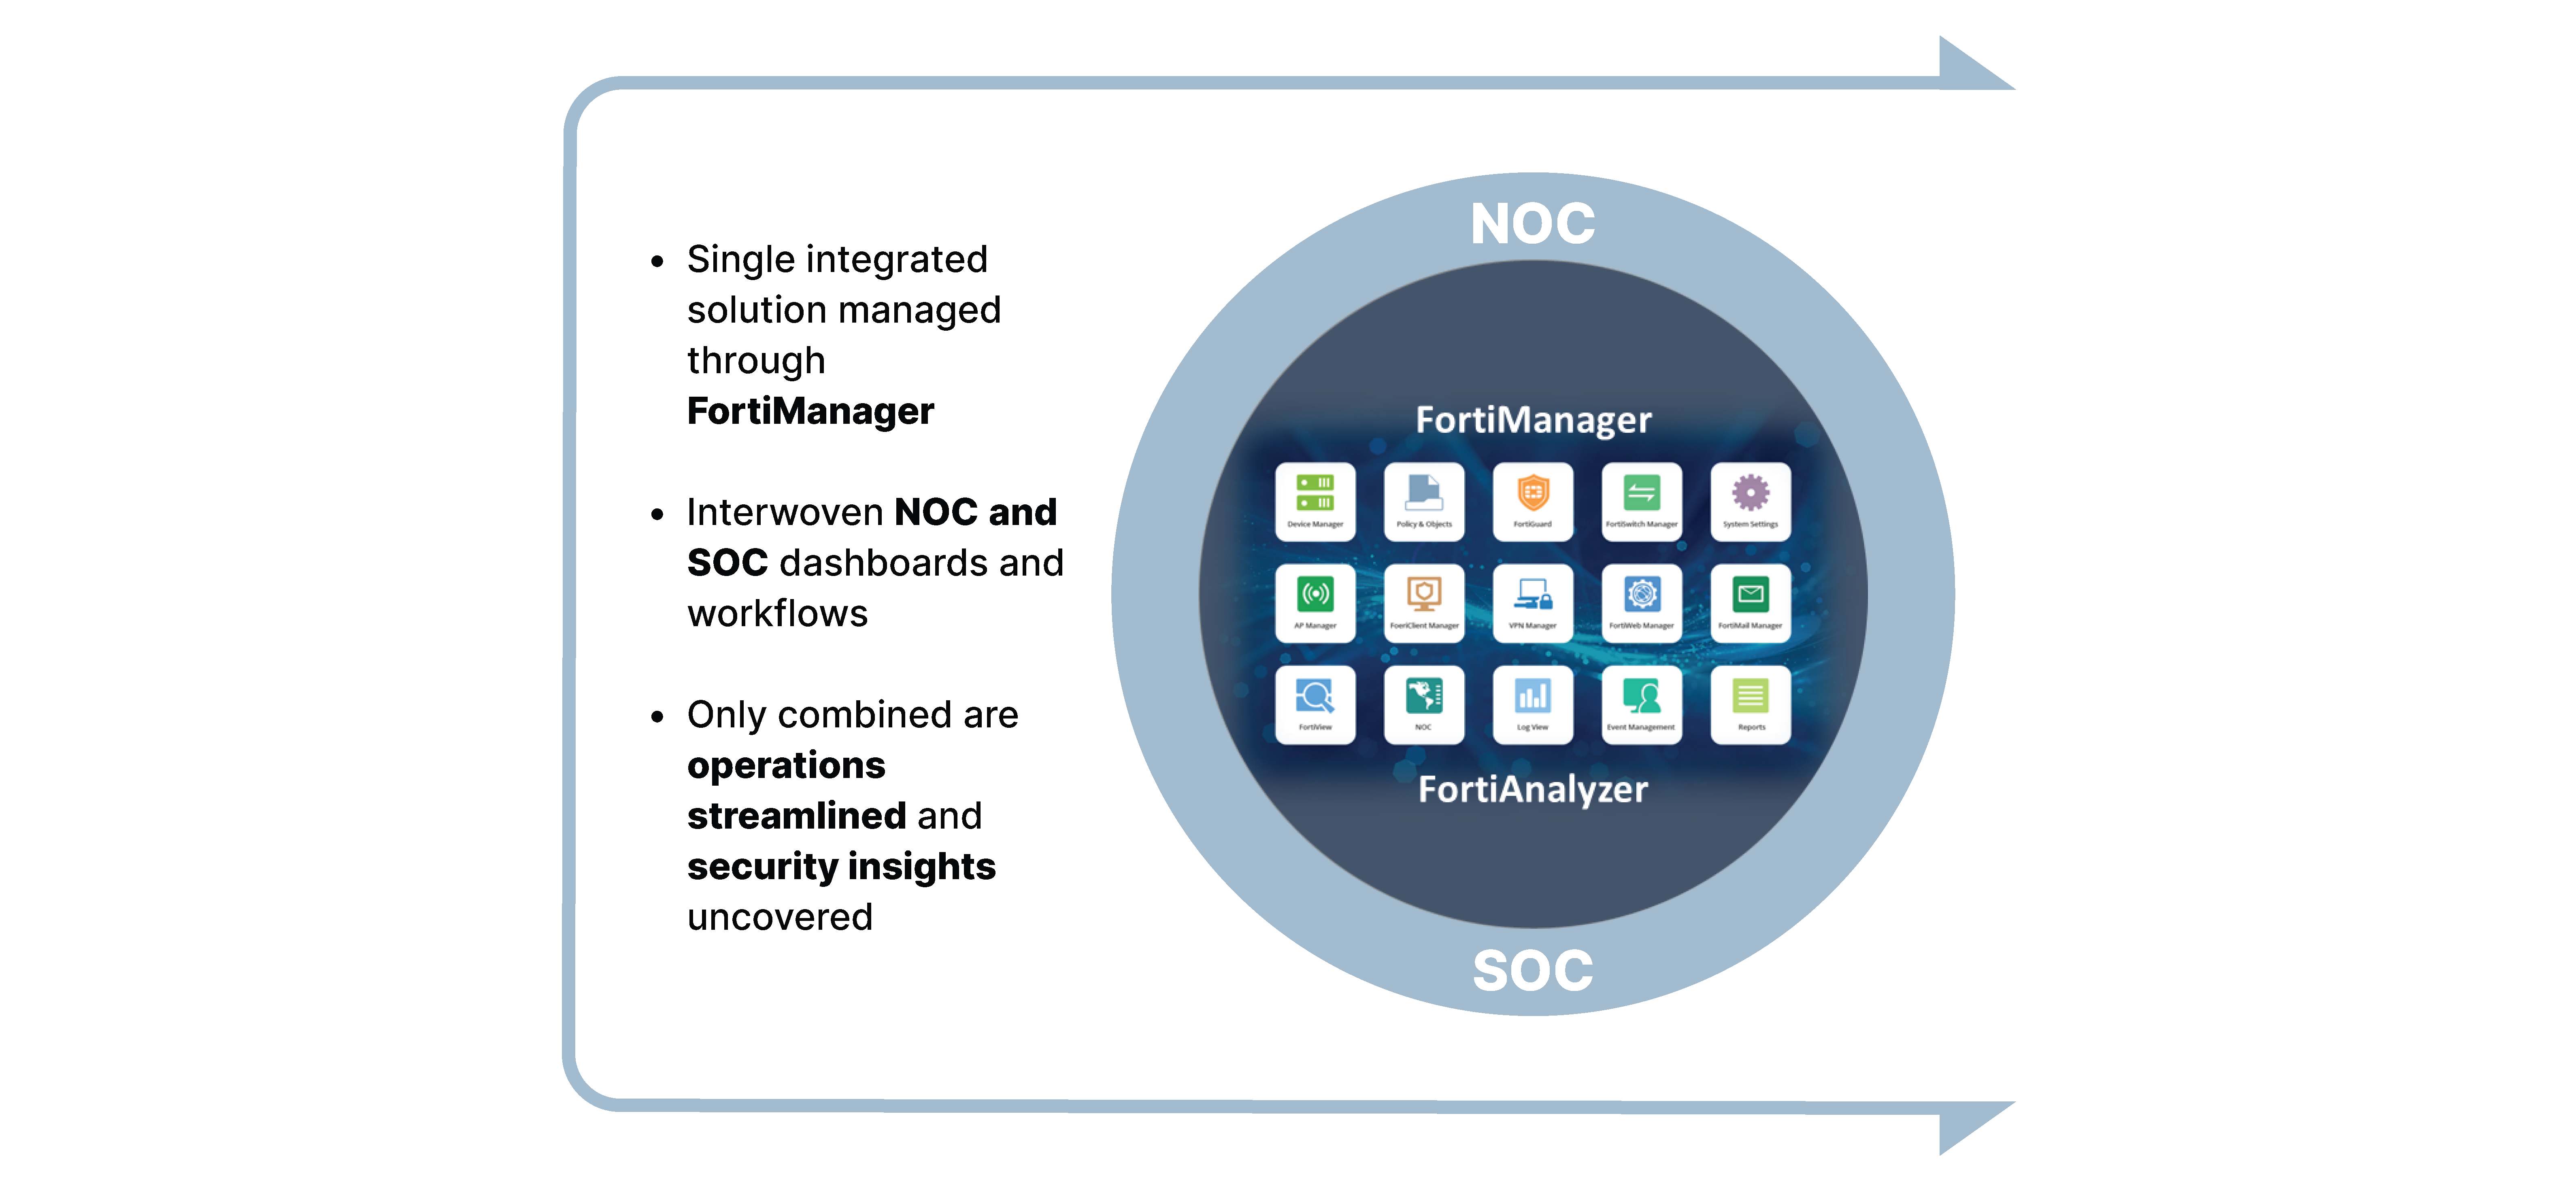
FortiManager monitoring and FortiAnalyzer analytics provide complimentary features that satisfy both NOC and SOC requirements. Following is a very high-level overview of monitoring versus analytic capabilities.
|
|
FortiManager Monitoring |
FortiAnalyzer Analytics |
|---|---|---|
|
Communication Method |
API |
Logging |
|
Device uptime and availability |
x |
|
|
System health monitoring |
x |
|
|
Bandwidth overview |
x |
|
|
FortiGate route table monitoring |
x |
|
|
IPsec tunnel monitoring |
x |
|
|
ADVPN monitoring |
x |
|
|
SD-WAN rule selection and steering monitoring |
x |
|
|
Performance SLA monitoring |
x |
|
|
Application performance |
x |
x |
|
Per-application bandwidth consumption |
x |
|
|
Single page network summary |
x |
|
|
SD-WAN rule and interface utilization |
x |
|
|
Advanced SD-WAN analytics (per device and network) |
x |
|
|
Pre-built or custom reporting |
x |
|
|
Custom log dashboard |
x |
|
|
Long term log storage |
x |
While FortiManager has basic FortiAnalyzer capabilities, it is generally recommended to leverage a dedicated FortiAnalyzer appliance for deeper analytics, log storage, and reporting.
This section includes the following topics: