


Configuring an example automation stitch
Let's try creating an example automation stitch with a simple pipeline. The example pipeline is as follows:
- When an event log is created due to a successful login to the FortiGate,
- Pick up one of the key-value pairs that the FortiGate sends to the API gateway
- Invoke its AWS Lambda script, and, as an action, output the value on CloudWatch
Other actions you may want to configure include quarantining an EC2 instance by applying a different security group, renaming an EC2 tag, and so on. You can configure a variety of actions as fits your deployment scenario.
For this example, do the following:
- Create an automation stitch by completing all steps in Creating an automation stitch.
- Under Trigger, select Event Log.
- In the Event dropdown list, select Admin Login Successful.

- You will need to know what elements FortiGate sends with the event log and what to pick on the Lambda script. Now let's make the example event happen by logging into the FortiGate successfully as an admin user. Log out of the FortiGate, then log in again. You will see the corresponding event log.
- Go to Log & Report > System Events. Find the desired event log.
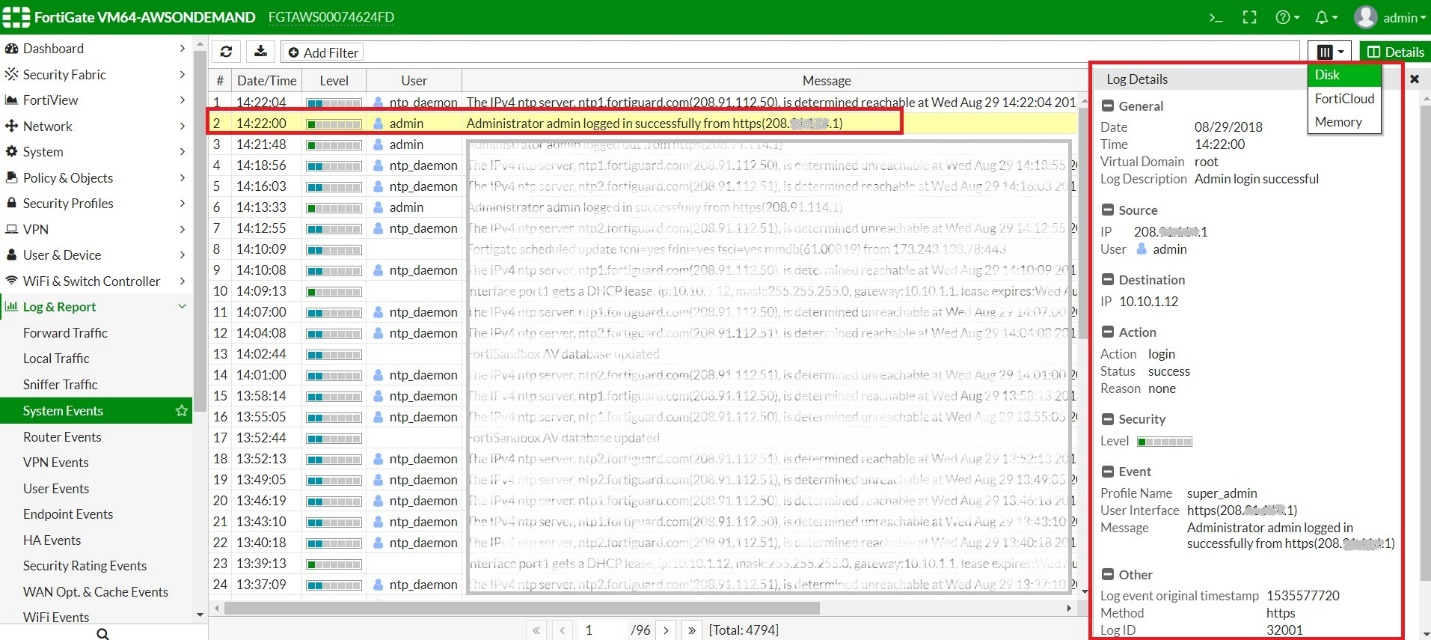
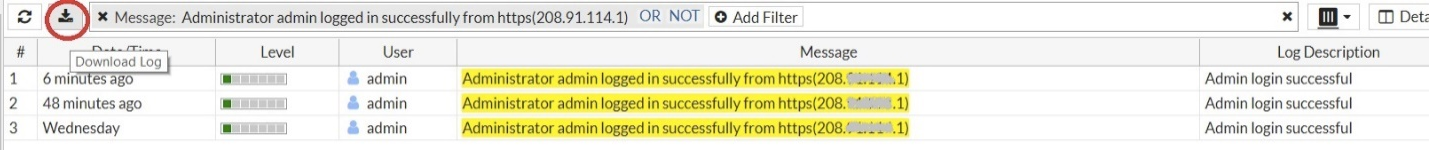
- Download the log as a file. You can filter logs as shown below.
- Open the SystemEventLog-disk-<date/time/number>.log file in a text editor. It should look as below.
date=2018-08-29 time=15:56:13 logid="0100032001" type="event" subtype="system" level="information" vd="root" eventtime=1535583373 logdesc="Admin login successful" sn="15355xyz73" user="admin" ui="https(208.xx.yy.1)" method="https" srcip=208.xx.yy.1 dstip=192.168.1.15 action="login" status="success" reason="none" profile="super_admin" msg="Administrator admin logged in successfully from https(208.xx.yy.1)"
You have a rough idea about what elements can be picked. Raw JSON data will look as follows:
{ email: 'your_email@xyz.com',
data:
{ stitch: 'Your Stitch Name',
actions: [ [Object] ],
eventtype: 'logid',
sn: 'Serial Number of your FortiGate',
time: 1535587464,
rawlog:
{ date: '2018-08-29',
time: '17:04:24',
logid: '0100032001',
type: 'event',
subtype: 'system',
level: 'information',
vd: 'root',
eventtime: '1535587464',
logdesc: 'Admin login successful',
sn: 'xyz',
user: 'admin',
ui: 'https(FortiGate IP address)',
method: 'https',
srcip: 'FortiGate IP address',
dstip: '10.10.1.12',
action: 'login',
status: 'success',
reason: 'none',
profile: 'super_admin',
msg: 'Administrator admin logged in successfully from https(FortiGate IP address)'
}
}
}
- You can pick available key-value pairs in your AWS Lambda code. In this particular event log, useful keys include stitch / date /time / vd / logdesc / user / ui / method / srcip / dstip / action / status / profile / msg.
- You can see all JSON logs sent by FortiGate on CloudWatch Log by entering the following line in the Lambda code:
console.log(JSON.parse(event.body));
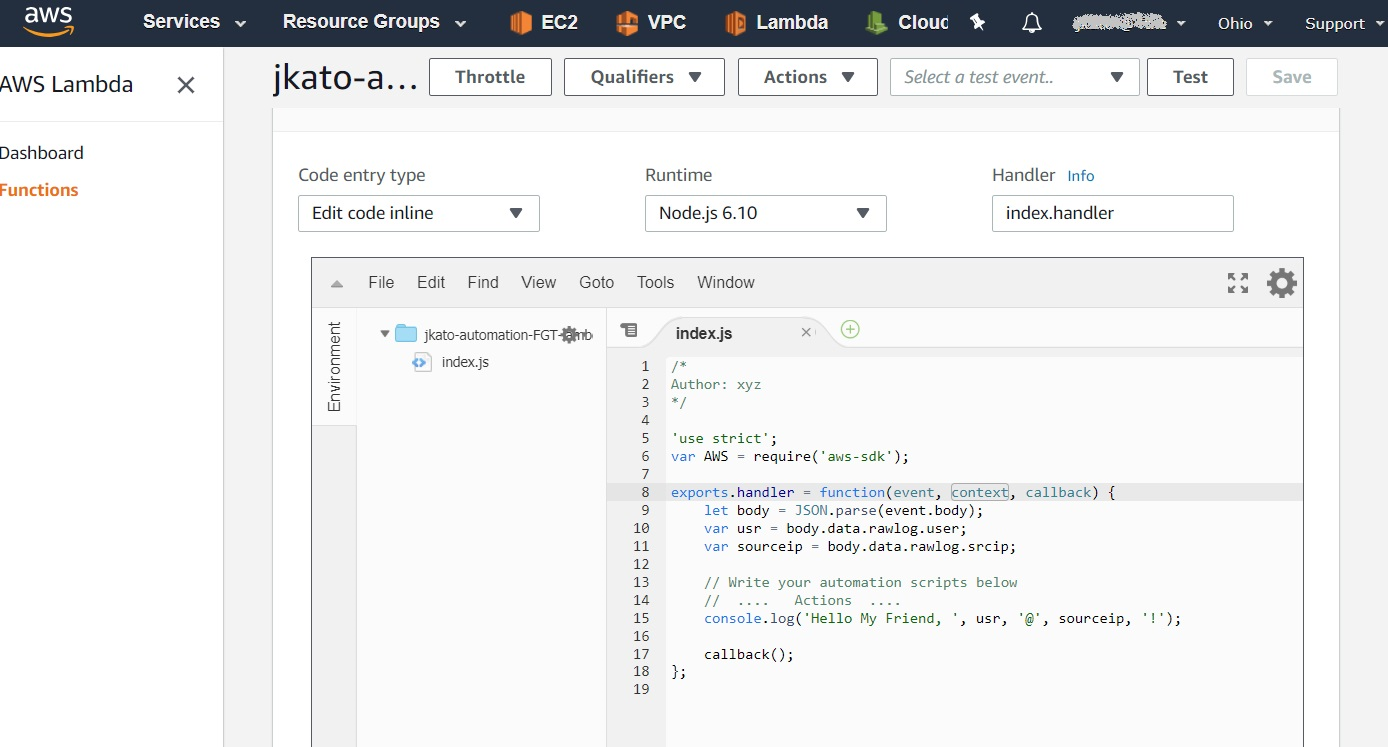
- Now, as an example, let's pick
user: 'admin'andsrcip: '208.xx.yy.1'. Here is the Lambda script:'use strict';
var AWS = require('aws-sdk');
exports.handler = function(event, context, callback) {
let body = JSON.parse(event.body);
var usr = body.data.rawlog.user;
var sourceip = body.data.rawlog.srcip;
// Write your automation scripts below
// .... Actions ....
console.log('Hello My Friend, ', usr, '@', sourceip, '!');
callback();
};
This is what the Lambda script will look like:
- Save the script.
- Log out of the FortiGate, then log in again as an administrator. This triggers the event log. The Lambda code is invoked, and CloudWatch Log shows something like the following:
