Fortinet black logo

User Guide

24.2.0

Topology Maps

Topology Maps

Topology Maps help network and IT administrators to find the interconnections and relationships between devices in an IT infrastructure. With an overall view of the network, administrators can better visualize the dependencies of devices. Filters, search, and toggles can be used to narrow down or customize the map. Multiple topology views can also be created.

Scans of the whole IT infrastructure is performed nightly to update the map.

Data collection

  • SNMP network devices by performing SNMP walks against the LLDP and CDP MIBs on each monitored network device. Enable LLDP or CDP on network devices to expose this data.

  • Fabric network devices topology data directly from the Fabric APIs used for discovery and provisioning.

  • VMware infrastructure topology data from the VMWare APIs used for discovery and provisioning.

Note: If you enable LLDP/CDP or add Fabric integrations, the topology map will not be updated with new data until after the next nightly scan.

Topology page

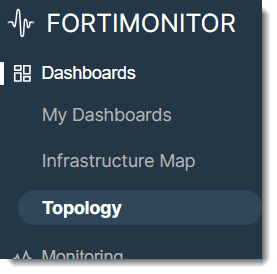
To get started, select Dashboards > Topology from the navigation menu.
Basic controls

With the available basic controls, you can zoom in/ out the map using the magnifier icons. Click the Fit View button to view the entire map on your screen.

Filters and toggles

The following filters and toggles are available:

  • Labels – Toggle to display labels

  • Device Types filter – Select the devices you want to display from the dropdown

  • Instances – Only show monitored instances without an incident

  • Instances with warning incident – Only show monitored instances with an active warning incident

  • Instances with critical incident - Only show monitored instances with an active critical incident

  • Unmonitored – Only show unmonitored instances

You can also use the search box to search for and display specific network devices.

View instance details

Click a monitored instance to view its availability and response times.

For a detailed view of the instance, including its maintenance schedule and incidents, click Details. Note that you can also add a maintenance from the instance drawer.

Monitor an unmonitored instance