


Salesforce
FortiMonitor's Salesforce integration allows you to post incidents detected by FortiMonitor as cases to your Salesforce environment. To set up the integration, you need to do the following:
-
Configure a new connected app in Salesforce.
-
Reset your security token.
-
Set up the integration in FortiMonitor.
These procedures are detailed in their respective sections below.
Configure a new connected app in Salesforce
-
Log in to Salesforce then click Setup.

-
Click New Connected App.

-
In the Basic Information area of the page, specify the following information:
-
Connected App Name – Specify a name for the connected app.
-
API Name – A unique identifier used when referring to the app. You can hit [Tab] to automatically populate the field. The API Name defaults to the App Name, replacing spaces with underscores.
-
Contact Email - Specify an email address to associate with the connected app.
-
-
In the API (Enable OAuth Settings) area, configure the following:
-
Enable OAuth Settings – Click the checkbox to enable the option.
-
Callback URL – Enter https://fortimonitor.forticloud.com.
Note: New users should use fortimonitor.forticloud.com for the SSO URL. For long time customers of FortiMonitor, continue using my.panopta.com. -
Selected OAuth Scopes – Select Access and manage your data (API).
-
Require Secret for Web Server Flow – Click the checkbox to enable the option.

-
-
Click Save.
-
Click Continue.

-
On the next page, take note of your Consumer Key and Consumer Secret. You will need to specify these when configuring your Salesforce integration in the FortiMonitor Control Panel.
Reset your security token
-
Click your avatar then click Settings to open your profile settings.
-
Under My Personal Information, click Reset My Security Token.

-
Click Reset Security Token.
-
You will receive an email with your security token. Copy the token. You will need to specify this when configuring your Salesforce integration in the FortiMonitor Control Panel.
Set up the integration
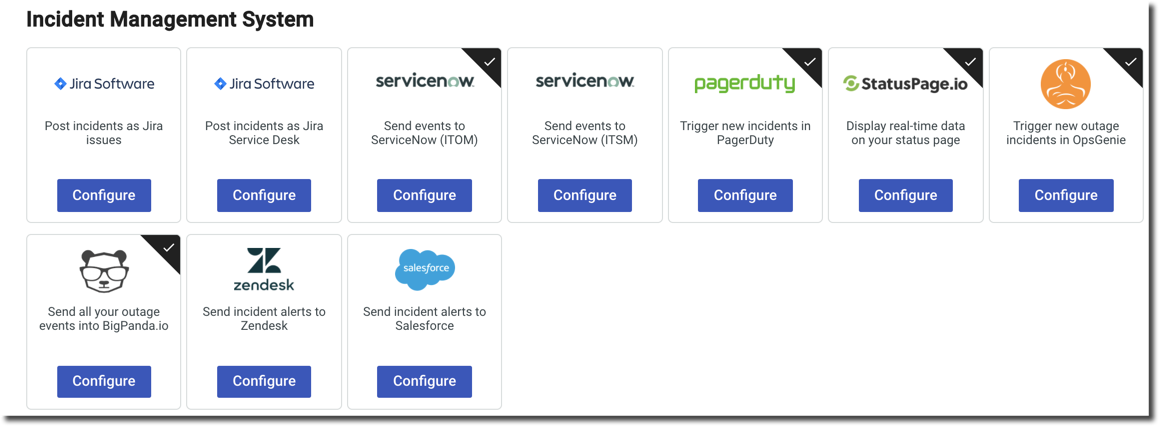
The Salesforce integration can be set up via the Integrations page.
-
Log in to FortiMonitor.
-
From the main navigation header, select Teams & Activity > Integrations.
-
Locate the Salesforce card then click Configure.
-
Configure your Salesforce integration. The configuration options are detailed in the following table:
|
Field |
Description |
|---|---|
|
Title |
Enter a name for the Salesforce integration. |
|
User Email Address and User Password |
The email address and password you use to log in to Salesforce. |
|
Consumer Key |
The Consumer Key from the Salesforce connected app you created. See Configure a new connected app in Salesforce. |
|
Consumer Secret |
The Consumer Secret from the Salesforce connected app you created. See Configure a new connected app in Salesforce. |
|
Security Token |
Security token from Salesforce. See Reset your security token. |
|
Close State |
Enter the name of the transition to apply when an incident is resolved. Make sure your Close State value corresponds to a valid status in your Salesforce instance. |
|
Sandbox |
Enable this option if you are testing inside a Sandbox instance. |
5. Select Save.
6. Click the Payload tab.
7. Customize the Outage and Clear incident parameters. These parameters are used for cases that will be created in Salesforce when an incident is detected or is resolved. The parameters you can use are detailed in the following sections.
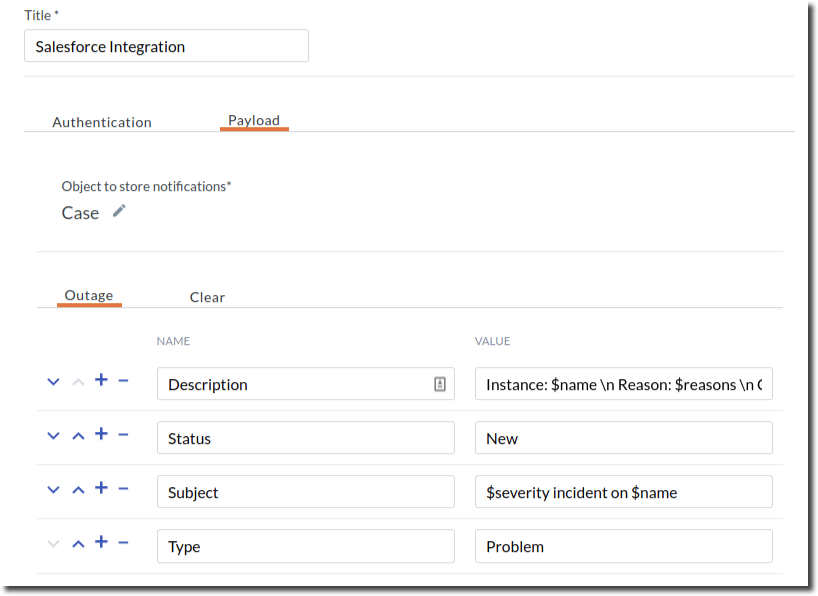
8. Select Save Payload.
9. Go to the Configured Integrations tab to verify your Salesforce integration.
10. To set up notifications, configure the integration's Alert Timeline.
Parameters
|
Parameter |
Description |
|---|---|
|
$trigger |
The type of event that triggered this payload (outage, ack, broadcast, clear) |
|
$fqdn |
The Fully qualified domain name of the server experiencing the incident/clear. |
|
$name |
Name of the server experiencing the incident/clear. |
|
$timestamp |
UTC timestamp of when the incident/clear occurred. |
|
$event |
The type of event, either incident event or clear event. |
|
$outage_id |
The ID number of the associated incident. |
|
$services |
For service incident: services experiencing the incident/clear. |
|
$compound_service_id |
The ID number of the compound metric affected. |
|
$network_service_id |
The ID number of the network service affected. |
|
$resource |
For resource anomalies: resources experiencing the anomaly/clear. |
|
$server_resource_id |
The ID number corresponding to the resource affected. |
|
$items |
Services experiencing the incident/clear or resources experiencing the anomaly/clear. |
|
$reasons |
The reasons for network service incidents or the details for anomalies. |
|
$duration |
The duration of incidents/anomalies which will be filled in on-clear. |
|
$tags |
The tags for the server. |
|
$server_key |
The server key for the server. |
|
$server_id |
The ID number of the server experiencing the incident/clear. |
|
$partner_server_id |
The partner server id for the server. |
|
$item_type |
The service type textkeys of the services experiencing the incident/clear, or plugin_textkey/resource_textkey combinations of the resources the experiencing the anomaly/clear, or the OID name of SNMP resources experiencing the outage/clear. |
|
$custom_attribute |
You can pass custom server attributes that are set on your servers. Use the attribute type as the key. |
|
$alert_label |
Alert label of the incident/anomaly. |
|
$severity |
The severity of the outage/anomaly, either critical or warning. |
|
$metric_tags |
The tags for all of the metrics involved in the outage. |
|
$location |
A comma-separated list of the primary monitoring probe names for all network services affected. |